 | |
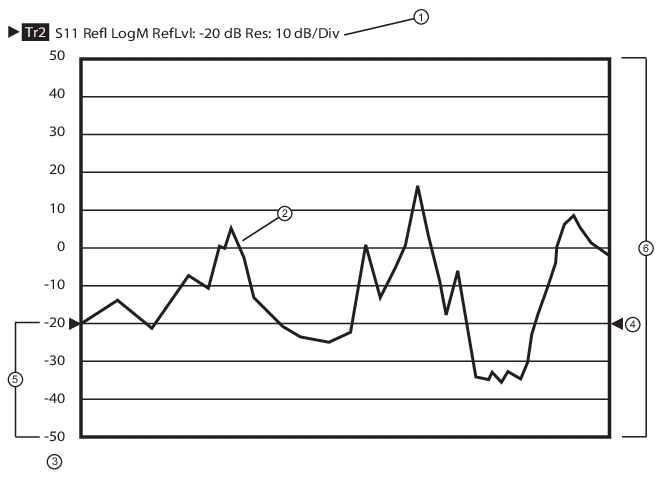
1. Trace Label – The trace label appears above the trace graph. The example above shows Trace 2 measuring S11, displayed on a Log Magnitude graph, with a Reference Level of -20 dB, and a graph resolution of 10 dB per vertical division. 2. Response Graph – A typical S11 response graph. 3. Resolution in Units per Division – The example shows 10 dB per division. | 4. Reference Line Pointers – Reference lines are only available in rectilinear trace graphs and are indicated by the paired arrows on the trace graph display and show the position of the reference value on the Y-axis scale. The example Reference Value is set to -20 dB. Click-hold-and-drag the line pointers to change the reference line value. 5. Reference Position – The example Reference Position is set to 3. Click-hold-and-drag the reference position scale to change the position of the graph on the Y-axis up or down. The value of the Reference Line Points does not change. 6. Number of Vertical Divisions – The example number of vertical divisions is set to 10. |