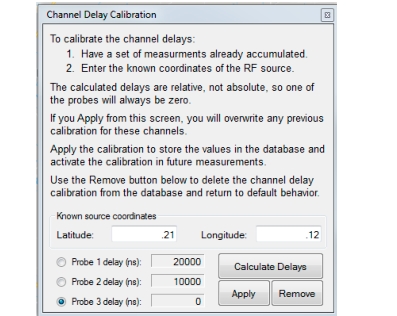
Read the calibration instruction in the Channel Delay window. Once the above parameters have been set, IQ Capture may begin.
Channel Delay Calibration Window
Click Start Data Collection. This process will take a few moments. Each remote probe is sent commands to configure the spectrum monitor as specified. Then IQ capture is initiated. It is essential for IQ captures to be synchronized in time, so each monitor will begin capturing data at the next GPS synchronization signal. The capture time is typically fairly short, several 10’s or 100’s of milliseconds.
After IQ data has been captured on the target receivers, it must be transferred over the network to the PC running Vision. This transfer can be slow, depending on the bandwidth available for communication with the target receivers. The IQ data sets are very large, typically 10’s of megabytes. Click Stop Data Collection when you decide sufficient data has been collected.
There are four progress bars below the IQ Capture Settings section of the dialog window. The first will show activity as the monitors are configured and the IQ data is actually captured. The other three progress bars indicate the progress for each of the monitors at transferring the data. The color bars will be completely filled once the capture is complete. The transfer is typically the longest part of this process. The progress bars are color coded to match the IQ charts.
At the completion and calculation of the IQ data, you can see the results in the Correlation Results section of the TDOA dialog window. In the diagram above, a yellow, green and blue line are also drawn on the map of the Locater Window. Each line represents a path that has the same distance differential from two of the monitors. The TDOA algorithm indicates that the source is located somewhere along that path. By using a set of three monitors, we get three distant paths. The intersection of all three paths marks the location of the RF source. A green square marker with a star is placed on the map at the intersection of the lines.