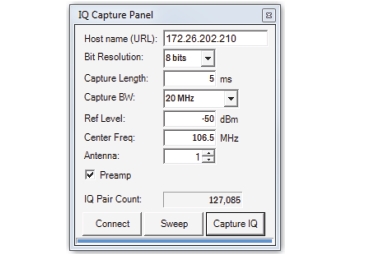
Click IQ Capture for directly capturing IQ data from a Remote Spectrum Monitor probe. This opens a dialog to enter the spectrum monitor parameters and capture the data. Once the capture is complete, the data will be loaded as input. A status bar at the bottom of the dialog displays the download progress. When completed the progress bar turns green.
• To save, select the desired output file type and click Convert File.
IQ Capture Panel
Converting MG3710A IQ Data File
These pattern files can be converted for playback on an Anritsu VSG enabled handheld spectrum monitor. MG3710A pattern files come in file sets. You need at least two files to successfully do the conversion. The first file has a .wvi file extension. Open this file in a text editor. Scroll down in the file and note the bandwidth, data points, RMS value, and peak power.
The second file you need has the same file name, but ends with a wvd file extension. This second file has the IQ data points and is in a binary format. Open the file and select Binary, 16-bit, big-endian. The correct pattern should appear in the Input graph. Compare the RMS value and peak power you noted before. These should closely match those values shown under the Input File Description in IQ File Converter. The data points value from the .wvi file should exactly match the Sample Count field.
If everything looks good, you can resample and save the file to which ever format suits your purposes.
Load the IQ Capture File
The first step is to load an existing file IQ Capture file into Anritsu IQ File Converter. Click the Input File button at the upper left-hand of the application window to select input file. Note that you may need to change the file type in the Open dialog box to find the file you are looking for. This is done by opening the file type drop down list right of the File name: input box and selecting the desired file type. Once the file is loaded, data will display in the Input and Output graphs.
The Input and Output I/Q data of the data file match and the same graphs drawn for both. Resampling the data will produce a difference between the input and output graphs. If you do not resample, then the expectation is that the exact same data points in the input file will go into the output file.
By default, the INPUT and OUTPUT graphs show I. You can switch between I, Q, and Magnitude by selecting the I, Q, and M buttons in the upper right-hand corner of the INPUT graph.
I/Q data files tend to be very large and can easily have several million I/Q data pairs in the file. This cannot all be displayed conveniently in a simple X/Y data chart on screen. The INPUT and OUTPUT graphs have a horizontal and vertical scroll bar to adjust what data is viewed. The vertical scroll bar adjusts the density of points. All the way to the top shows the data bunched together so that you can more easily see long time trends in the pattern. The horizontal scroll bar scrolls the data in time, from left to right.