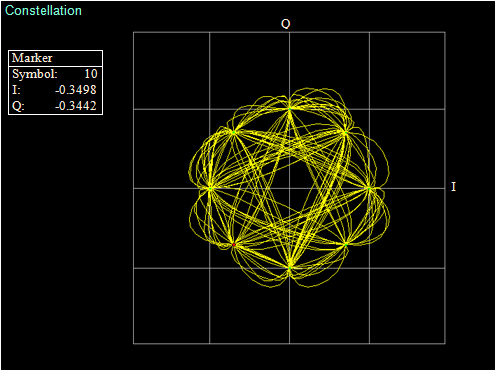
Displays the Constellation analysis result in the trace area. The result of each analysis is displayed.
Constellation Result
Graph Display Result
Displays the waveform in the analysis interval on the IQ axis. The IQ waveform is normalized and displayed with the vector of the outermost symbol position. When the modulation is set to 2FSK, 4FSK, or H-CPM, the frequency deviation of each symbol can be displayed with the horizontal axis as normalized frequency. Right-click the measurement screen to display the menu shown below.
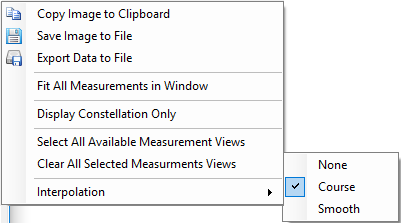
Constellation Display Menu
Copy Image to Clipboard
Copies image to clipboard. Image can be then viewed with a graphics editor.
Save Image to File
Name and save the image to a user selected file.
Export Data to File
Export the data to a user selected file.
Fit All Measurements in Window
Only the current active measurements are fit in the window for full view.
Display Constellation Only
Only Constellation view is displayed in full view.
Select all Available Measurement Views
All measurement views are displayed in the window.
Clear All Selected Measurements Views
Clears out all views.
Interpolation
Sets the data interpolation between the symbols displayed on the graph and the display complementation. On the interpolation display, data is interpolated by using the number of splits between symbols specified in Points/Symbol and a graph is displayed with each data connected with straight lines.
Settings
None
No interpolation applied to display.
Coarse
Coarse sampling rate applied to display.
Smooth
Increased sampling rate applied to display.
Resolution
Resolution when Frame Formatted or Non-Formatted is selected.
1 symbol
When Interpolation is set to None, Interpolation and Points/Symbol is set to 1 point.
0.5 symbol
When Interpolation is set to Coarse, Interpolation and Points/Symbol is set to 2 points.
0.125 symbol
When Interpolation is set to Smooth, Interpolation and Points/Symbol is set to 8 points.