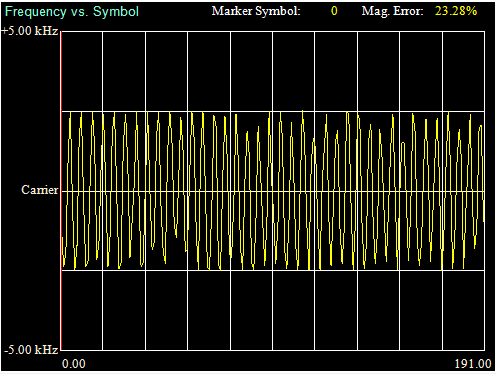
Displays Frequency vs. Symbol analysis result in the trace area. The result of each analysis is displayed, regardless of the storage mode.
Frequency vs. Symbol Result
Graph Display Result
Displays the frequency deviation of each 1/8th of the symbol interval in the analysis interval in Hz units. Right-click the measurement screen to display the menu shown below.
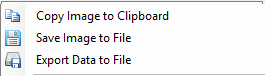
Frequency vs. Symbol Display Menu
Copy Image to Clipboard
Copies image to clipboard. Image can be then viewed with a graphics editor.
Save Image to File
Name and save the image to a user selected file.
Export Data to File
Export the data to a user selected file.
Marker
Click and rotate mouse-wheel to position a marker.