Displays the amplitude analysis result of the I phase and Q phase, in the trace area. The result of each analysis is displayed.
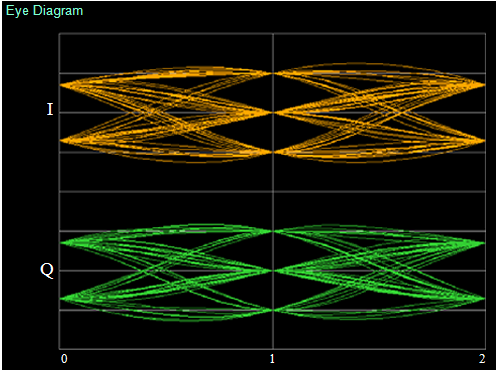
Eye Diagram
Graph Display Result
Displays the normalized amplitude of the I phase and Q phase for each 1/8th of the symbol in the analysis interval. When modulation is set to 2FSK, 4FSK, or H-CPM, the frequency deviation of each symbol can be displayed with the horizontal axis as normalized frequency. The graph's horizontal axis is displayed in 2-symbol intervals. Right-click the measurement screen to display the menu shown below.
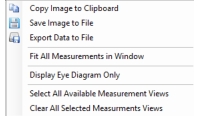
Eye Diagram Display Menu
Copy Image to Clipboard
Copies image to clipboard. Image can be then viewed with a graphics editor.
Save Image to File
Name and save the image to a user selected file.
Export Data to File
Export the data to a user selected file.
Fit All Measurements in Window
Only the current active measurements are fit in the window for full view.
Display Eye Diagram Only
Only Eye Diagram displays in full view.
Select all Available Measurement Views
All measurement views are displayed in the window.
Clear All Selected Measurements Views
Clears out all views.
Marker
Click and rotate mouse-wheel to position a marker.