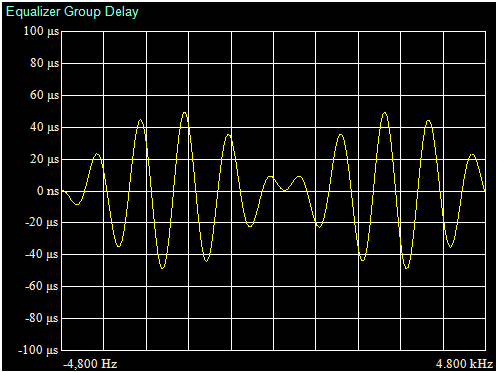
This displays the Equalizer Group Delay analysis results at trace. The analysis results are displayed each time irrespective of the Storage mode setting. The analysis results are displayed when either On or Hold is selected at the Adaptive setting of Equalizer.
Equalizer Group Delay
Graph Display Result
Displays the equalizer group delay characteristics in seconds. Right-click the to display the menu shown below.
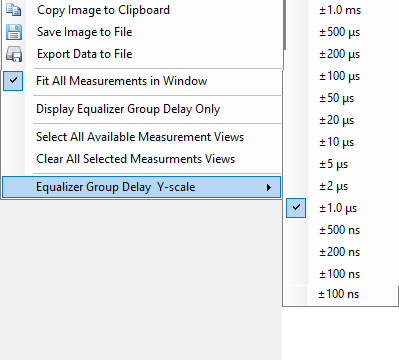
Equalizer Group Delay Display Menu
Copy Image to Clipboard
Copies image to clipboard. Image can be then viewed with a graphics editor.
Save Image to File
Name and save the image to a user selected file.
Export Data to File
Export data to a user selected file.
Fit All Measurements in Window
Only the current active measurements are fit in the window for full view.
Display Equalizer Group Delay Only
Only Equalizer Group Delay displays in full view.
Select all Available Measurement Views
All measurement views are displayed in the window.
Clear All Selected Measurements Views
Clears out all views.
Equalizer Group Delay Y-scale
Sets the upper limit of the vertical axis scale of the graph result.