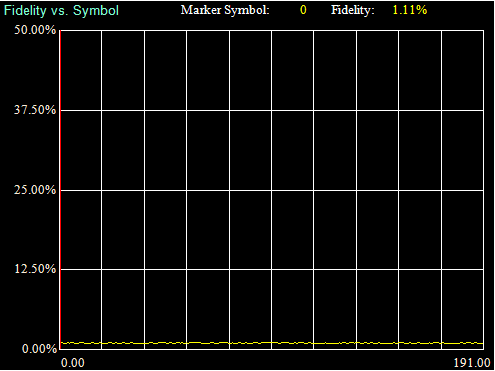
Displays the analysis results of Modulation Fidelity vs. Symbol in trace. The results are displayed only when the modulation is set to 2FSK, 4FSK, or H-CPM. The result of each analysis is displayed, regardless of the storage mode setting.
Fidelity vs. Symbol
Graph Display Result
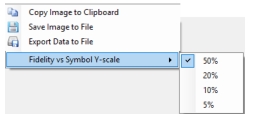
Displays Modulation Fidelity of each symbol in the analysis interval in percentage. Right-click the measurement screen to display the menu shown below.
Fidelity vs. Symbol Display Menu
Copy Image to Clipboard
Copies image to clipboard. Image can be then viewed with a graphics editor.
Save Image to File
Name and save the image to a user selected file.
Export Data to File
Export data to a user selected file.
Fidelity vs. Symbol Y-scale
Sets the upper limit of the vertical axis scale of the graph result.
Settings
5%, 10%, 20%, 50%
Marker
Click and rotate mouse-wheel to position a marker.