Displays the appearance frequency of each symbol in trace. The results are displayed only when the modulation is set to 2FSK, 4FSK, or H-CPM.
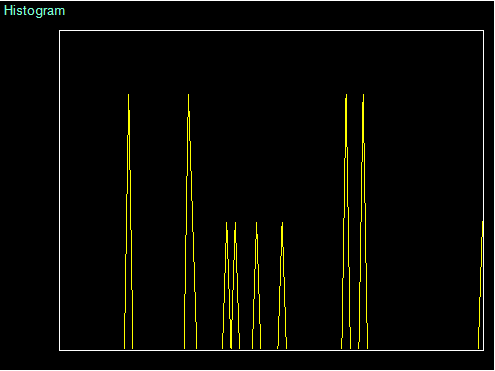
Histogram
Graph Display Result
Displays the frequency elements of each symbol. The horizontal axis represents normalized frequency and the vertical axis represents appearance frequency. Right-click the measurement screen to display the menu shown below.
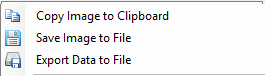
Histogram Display Menu
Copy Image to Clipboard
Copies image to clipboard. Image can be then viewed with a graphics editor.
Save Image to File
Name and save the image to a user selected file.
Export Data to File
Export data to a user selected file.
Scale
The graph's vertical axis scale is fixed to 0 to 1.