The linearity correction of the MA24105A is compared to a thermal power sensor, which has very good inherent linearity over a power range of about –20 dBm to +10 dBm. For this reason, the MA24105A will be compared to the thermal sensor in two ranges, keeping the power levels to the thermal sensor in the range of –17 dBm to +5 dBm, while the power to the MA24105A will vary from about –26 dBm to about +14 dBm.
a. Connect the reference power sensor to the reference power meter using the appropriate cables.
b. Connect the USB cable between the personal computer with the PowerXpert application installed and the MA24105A power sensor under test.
c. Launch the PowerXpert application.
d. Turn the power on to all of the instruments and allow them to warm up for the amount of time specified in the instrument’s respective manuals.
e. Reset or Preset all of the instruments.
f. Configure the reference meter and sensor to measure a CW signal.
g. Perform a sensor Zero and a 1 mW reference calibration on the reference sensor and meter per the manufacturer’s instructions.
h. Perform a low-level Zero of the MA24105A by disconnecting the sensor from the synthesizer, click the Zero button in the PowerXpert application, and wait for the Zeroing message to close.
i. Connect the power coupler to the output of the synthesizer and connect the 10 dB K attenuator using an adapter to the coupler’s coupling output.
j. Connect the low power 30 dB N attenuator to the other coupling output.
k. Connect the reference sensor to the 10 dB K attenuator using an adapter.
l. Connect the MA24105A to the output of the coupler.
m. Set the synthesizer to 350 MHz and a very low power level.
n. Increase averaging by entering “16” in the PowerXpert application, and then click Apply above settings.
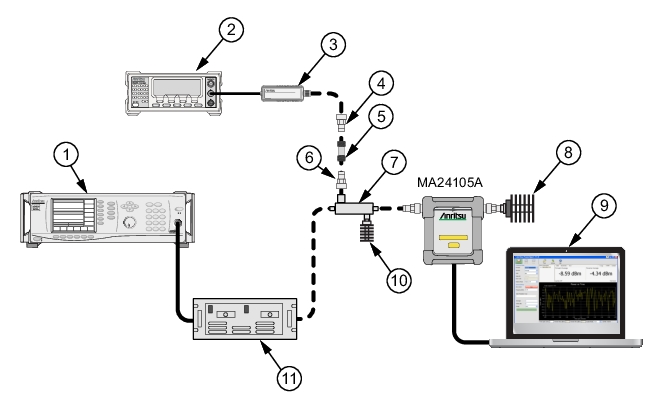
Linearity Test Setup 1
Index
Description
1
Synthesizer
2
Reference Power Meter
3
Reference Power Sensor
4
K to N Adapter
5
10 dB Attenuator N Type
6
K to N Adapter
7
Power Coupler
8
50 ohm Termination
9
PC with Anritsu PowerXpert Application
10
30 dB N Attenuator
11
Amplifier
2. Apply the Cal factor to the reference sensor per the manufacturer’s procedure.
3. Apply the Cal factor to the MA24105A by entering the frequency (in GHz) in the PowerXpert application, and then click Apply above settings.
4. Turn Off the synthesizer’s RF output and perform a low-level Zero of both the Reference sensor and the MA24105A.
5. Turn On the synthesizer’s RF output.
6. Adjust the synthesizer’s power until the MA24105A is reading approximately +45 dBm.
7. Record data for the first 20 dB range as follows:
e. Repeat the measurement for amplifier output levels of +35 dBm, +30 dBm, and +25 dBm. The MA24105A power measured at +25 dBm will be used in Step 8e,
8. Set up the test for the second 20 dB range as follows:
a. Remove the 10 dB K attenuator from in between the reference sensor and coupler, then connect the reference sensor directly to the coupler’s coupling port.
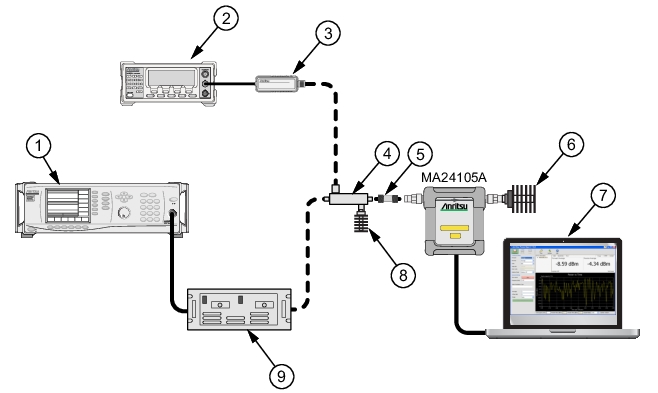
b. Remove the MA24105A from the coupler and connect the 10 dB N attenuator between the coupler and the MA24105A power sensor. See Figure: Linearity Test Setup 2.
c. Turn off the synthesizer RF output and perform a low-level Zero of both the Reference sensor and the MA24105A.
d. Turn on the synthesizer RF output.
Linearity Test Setup 2
Index
Description
1
Synthesizer
2
Reference Power Meter
3
Reference Power Sensor
4
Power Coupler
5
10 dB N Attenuator
6
50 ohm Termination
7
PC with Anritsu PowerXpert Application
8
30 dB N Attenuator
9
Amplifier
e. Set the amplifier output level to approximately 5 dB higher and then adjust the output level until the MA24105A reads as close as possible to the value obtained in Step 7e.
10. Perform the calculations and operational check as follows:
a. Subtract the Reference Power Measurement of row 5 from the Reference Power Measurement of row 6. Record this value in the Correction column of rows 1 through 5.
Note
The Correction column of rows 1 through 5 should all have the same value. The Correction column of rows 6 through 10 have values of 0.
b. Add the Reference Power Measurement and Correction values of row 1 and record the result in the Corrected Reference Power Measurement column of row 1.
d. Subtract the MA24105A Measurement of row 1 from the Corrected Reference Power Measurement of row 1 and record the result in the Difference Calculation column of row 1.
f. Find the largest (most positive) value in the Difference Calculation column and record this value next to the word Max in row 11.
g. Find the smallest (least positive or most negative) value in the Difference Calculation column and record this value next to the word Min in row 12.
h. Subtract the Min value from Step 10g from the Max value from Step 10f and record the result next to the word Delta in row 13.
i. The Delta result should be less than 0.3 dB. If it is larger, contact Anritsu customer service.
11. Repeat the entire measurement and calculations with synthesizer frequency settings of 2 GHz and 4 GHz.
Measurement Results (2 GHz)
Row #
Approx. Output Power of the Amplifier (dBm)
Attenuation in Reference Arm (dB)
A
Reference Power Measurement (dBm)
B = (A6–A5)
Correction (dB)
C = (A+B) Corrected Reference Power Measurement (dB)