Typically, calibration is done for a specific list of frequencies and then measurements are made over that same list of frequencies. While this is most accurate, it is not necessarily convenient. If, for example, one is measuring a variety of narrow bandpass filters of different center frequencies, it may be useful to be able to zoom in to look at the passband of each filter without re-calibrating. Interpolated calibrations are allowed for purposes like this one. The theory is that the error coefficients are all carefully interpolated between calibration points to minimize possible error.
To see the cause of error, note that the cable runs within the instrument and the cables that the user provides typically result in a large electrical length. Thus the error coefficient magnitude versus frequency is often periodic in shape. If the interpolation is not performed with care, large errors can result (see Figure: Effect of Step Size on Interpolation).
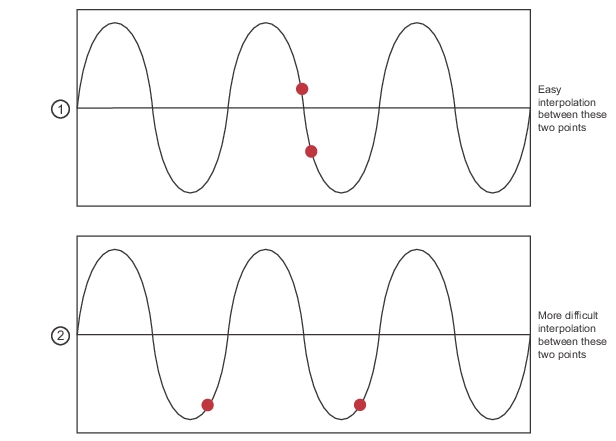
Effect of Step Size on Interpolation
Step size, interpolation effects, and possible errors.
1. Easy interpolation between these two points.
2. More difficult interpolation between these two points.
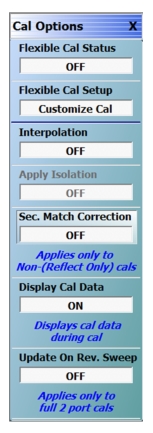
As a rule, the smaller the step size used during the calibration, the more successful the interpolation will be. It is desirable to keep the step size smaller than the ripple period of the coefficients which will typically range from 50 MHz to 500 MHz. The smaller number is for setups with very long test port cables and fully optioned systems; the larger numbers for setups with short test port cables and with Options 51, 61, and 62. The menu to select interpolation is shown in Figure: CAL OPTIONS Menu.
CAL OPTIONS Menu
The calibration interpolation menu will default to OFF where points used during measurement must correspond to calibration frequency points. When interpolation is ON, other points may be used. In neither case may frequencies outside of the calibration frequency range be used.
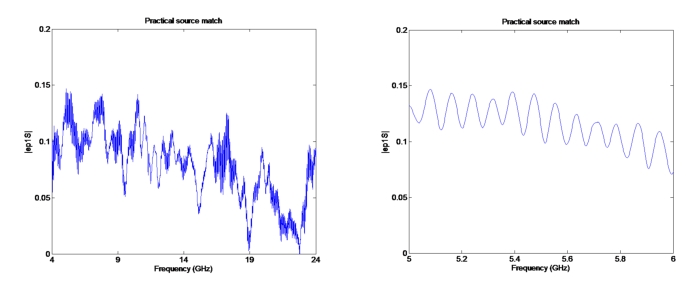
To gain a better understanding of the uncertainty implications of interpolation, it may be helpful to consider how the error terms of a typical calibration vary over frequency. A large scale and zoomed-in version of one parameter (source match) is shown in Figure: Large Scale and Zoomed-in Source Match Variation Over Frequency.. Even with relatively low point densities, the large scale variation in the large-scale plot would be captured by interpolation. The fine scale variation shown in the zoomed-in plot is, however, another matter.
Large Scale and Zoomed-in Source Match Variation Over Frequency.
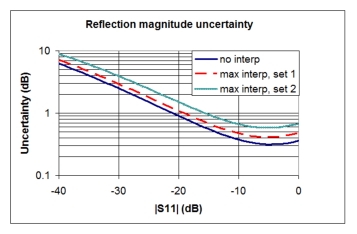
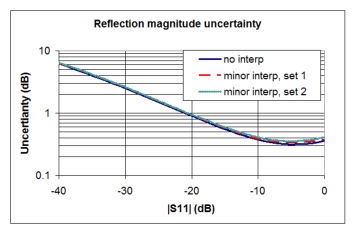
Now, consider two different sets of hardware, both with a nominal tracking coefficient of unity (for simplicity). At lower frequencies, set 1 may be readily achieved, but at millimeter wave frequencies, set 2 may be more practical. The important point is that the interpolation effects are setup-dependent.
• Set 1: Raw directivity ~ 0.02 (-34 dB) and raw source match ~0.1 (-20 dB)
• Set 2: Raw directivity ~ 0.10 (-20 dB) and raw source match ~0.3 (-10 dB)