Secondary match correction (SMC) is about improving measurement performance and reducing uncertainties mainly for measurements of very low insertion loss devices. At the frequency of interest, if the DUT loss is more than a few dB, this function will usually not have significant impact but it can offer improvements when DUT losses are smaller than that. Since the function slows down sweep updating, it is turned off by default. The function can be employed after any calibration (excluding reflection-only calibrations) is applied. This section will explore the SMC process and how it can be useful in a number of measurement applications.
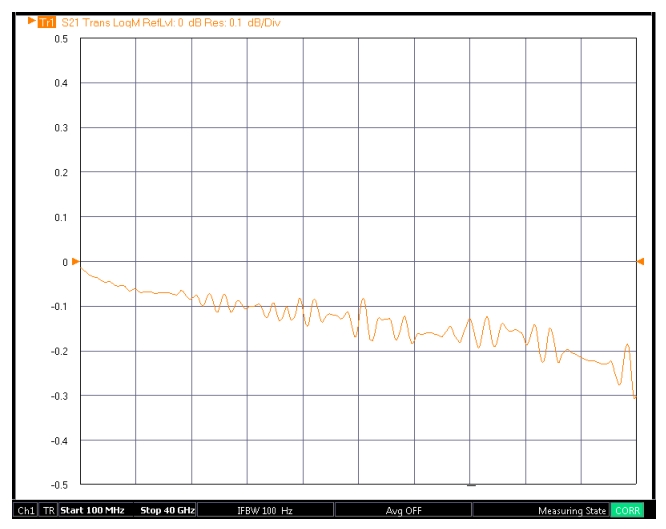
Suppose one is measuring a very low loss device (a precision adapter for example). One may get an insertion loss plot like the below when using a precision calibration kit in good condition. One may wonder about the ripple in the data in Figure: Example Low Insertion Loss Measurement. It is only about 0.05 dB peak at worst which is well below the measurement uncertainty of ~0.1 dB to 0.12 dB (peak) for this particular measurement but it still may be undesirable. One may notice that residual error terms are on the order of 30 dB to 35 dB and the DUT match may be on the order of 25 dB so one could even rationalize that multiple reflections between those (effective) interfaces may explain the result.
Example Low Insertion Loss Measurement
Some of this ripple can arise from high DUT reflections, from pin depth issues in the mating reference planes or with the DUT (or with the calibration kit!), or there may be other explanations. One source of that ripple, however, can be a residual effect related to how match is corrected in the basic VNA calibration. In other chapters of this guide, the basic VNA error model was discussed and part of it is the simple reflectometer structure which is shown in Figure: Reflectometer Error Model.
Reflectometer Error Model
The simple reflectometer error model is sketched here along with the mapped effects to a physical reflectometer.
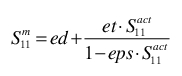
The error model arose from actual defects that occur in a physical reflectometer: finite directivity of a coupling structure, finite match of the coupler and nearby components, and a non-flat frequency response of the signal chain. Of particular interest to this discussion is match and, like with all models, how it is treated here is something of a simplification. Consider a slightly more complete model diagram in Figure: Reflectometer Expanded Model. Suppose the dominant source of actual mismatch is at position Y in the figure. When the signal propagates from the source, some energy is reflected back to the source and some is transmitted. Of the portion transmitted, some reflects off of the DUT and then re-reflects off of Y. The product of those reflections (~eps*S11 where eps is the source match term in the calibration terminology discussed earlier in this guide and S11 is the reflection coefficient of the DUT) is important since the product repeats on multiple re-reflections forming a geometric series. Thus when one looks at the basic reflectometer equation, the tell-tale result of an infinite geometric series is present in the denominator.
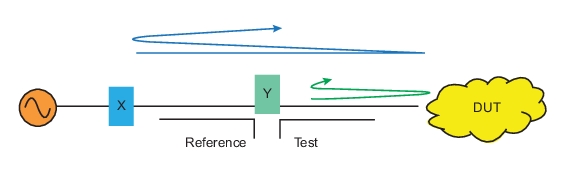
Equation 10‑1. Basic Reflectometer Equation
Here S11act is the actual reflection coefficient of the DUT and the ‘m’ superscript on the left side denotes ‘measured’. Port 1 was used for this equation but any port could have been employed. In the case of Y being dominant, everything works out since the test coupler sees all of the multiple reflections and the actual measurement is very close to what the simple error model would arrive at.
Reflectometer Expanded Model
An expanded sketch of the reflectometer is illustrated here.
Something different can happen if a significant reflection occurs at X. Now the reference coupler sees the mismatch as does the test coupler so the ratio that forms S11, test/reference, sees a distorted picture of the reflection product and the reflectometer equation is really not as simple as that shown above. The test coupler will indeed see the effective series of reflections but the reference coupler sees some of it as well and the ratioing produces a partial cancellation or amplification depending on phasing.
The significance of these X and Y reflection locations can vary greatly from setup to setup but there are cases where the X location is non-negligible. It should be emphasized that these effects are smaller than quoted uncertainties as the uncertainty component evaluation process is also affected by the above mechanism. It should also be mentioned that this represents a fairly small perturbation on the effective port match so would not be visible on higher DUT loss measurements (more than a few dB) and, even for low loss DUTs, is generally only visible on a fine scale.
One could add additional calibration standards to solve for this more elaborate match model but this would lengthen the calibration process. One can also use the phase information in the calibration residuals to localize where the mismatch elements are. This is the principle behind secondary match correction: use the residual phase information to process a 2nd tier correction that primarily impacts the match terms.
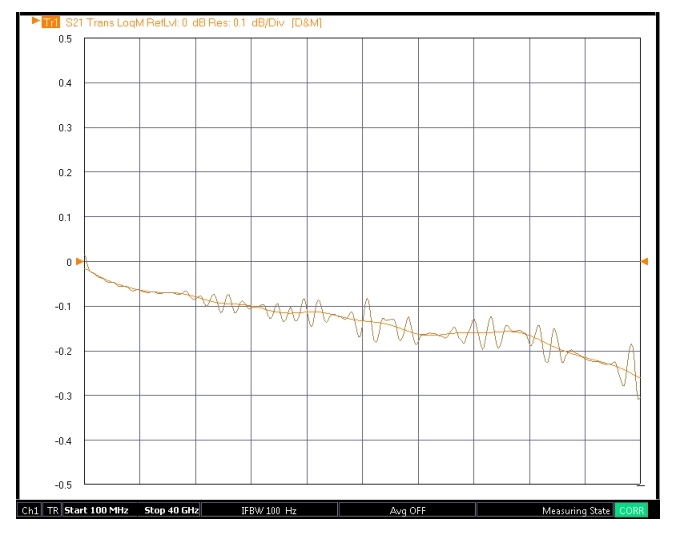
Applying this to our previous example of the adapter measurement, one can see a significant reduction in the ripple (Figure: Adapter Insertion Loss Measurement—Without/With SMC) that was not part of the DUT behavior after all (lighter trace is with SMC applied).
Adapter Insertion Loss Measurement—Without/With SMC
An adapter insertion loss measurement without SMC (darker trace) and with SMC (lighter trace) is shown here.
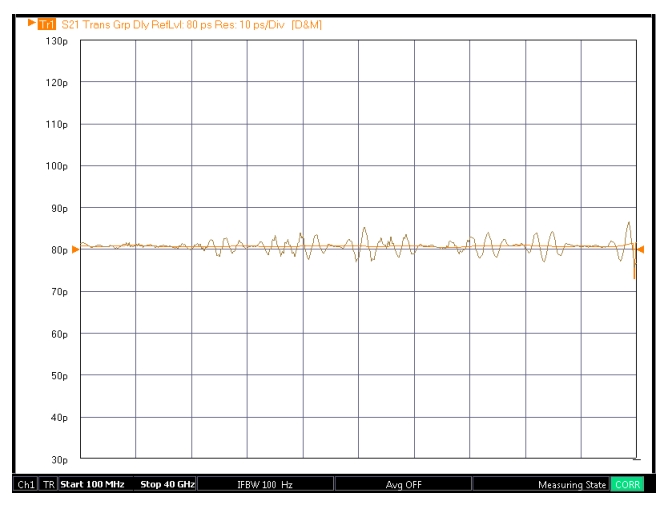
A similar effect can be seen in the group delay measurement of the adapter (see Figure: Adapter Group Delay Measurement—Without/With SMC). Although the effect is only a few ps of delay, it may be important in some applications such as careful delay-matching exercises or fine modulation distortion calculations based on measurements of a transceiver’s group delay.
Adapter Group Delay Measurement—Without/With SMC
A group delay measurement of an adapter without SMC (darker trace) and with SMC (lighter trace).
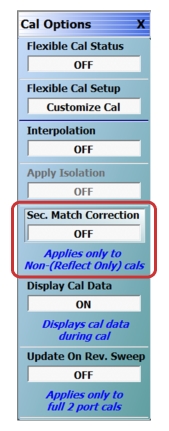
Using secondary match correction only requires turning the selection ON under the Cal Options Menu as shown in Figure: Cal Options Menu Showing Secondary Match Correction Button. Whenever an appropriate calibration is applied, then SMC will also be applied to the parameters. The appropriate calibration types include full 2-, 3-, and 4- port calibrations, transmission frequency response calibrations, and 1-path 2-port calibrations. SMC will not be applied to 1-port (reflection only) or reflection response calibrations. Since this is part of the correction engine, user-defined parameters (b2/1, b2/a1...) are not affected.
Cal Options Menu Showing Secondary Match Correction Button
There are few things to keep in mind about the behavior of this correction:
• If the frequency list is such that the phase residuals provide little information, then the correction will not be applied. This will happen if the step size is very large (~>1 GHz will limit the method’s value) or if the frequency range is extremely small (~< 2 GHz will limit the value). In segmented sweeps with very irregular steps (step sizes deviating more than about 2% from the mean step size in the frequency list), the correction will not be applied.
• If extremely long test cables are used, the method may have less of an effect since mismatch is now concentrated in front of even the test coupler (which causes other issues with measurement stability anyway).
• If SMC is ON and one saves .sNp files, the SMC correction will be applied to relevant parameters. SMC will always flow through to .txt and .csv files.
In summary, the secondary match correction process allows one to optimize measurements of low insertion loss devices by correcting for a simplification made in the standard error model. The improvements are usually on the scale of hundredths of a dB in insertion loss and picoseconds in group delay but, particularly for low loss adapter and fixture characterization, those enhancements can be valuable.