The VectorStar Noise Figure Uncertainty Calculator is a standalone program used to provide the user a tool for easily determining measurement uncertainty while using the VectorStar VNA Option 41—Noise Figure. The calculator can be used for non-frequency converting active devices, such as amplifiers. The uncertainty calculator takes into account the five primary parameters of the system configuration:
• Receiver parameters
• DUT parameters
• Power measurement parameters
• Source parameters
• Cold source temperature
In addition, the calculator is helpful in determining the optimum measurement setup for achieving a desired measurement uncertainty target.
Installation
The calculator is installed on the VectorStar instrument desktop and can also operate on an external Windows XP or Windows 7 PC as a standalone executable that is launched from the Program Menu or the desktop Icon shown below.
Desktop Icon in Windows for Noise Figure Uncertainty Calculator
To start the standalone Noise Figure Uncertainty Calculator installation on a local PC, select the Setup_XXXX.exe file (where the XXXX provides the calculator revision) and follow the installation dialogs.
Best practices recommend pinning the calculator to the Start Menu and to also create a short-cut on the desktop.
For more information, refer to the Installation Guide contained in the InstallationGuide.txt file, which is provided with the Uncertainty Calculator download package.
User Interface
The program user interface provides editable fields for the most common noise figure measurement test setup variable parameters, such as composite receiver and DUT information. When the Calculate button is pressed, the input is used to determine the overall measurement uncertainty. Conversely, a desired DUT uncertainty value can be input and the calculator will provide a display of required receiver performance (gain and noise figure) for a given DUT performance.
The Advanced Setup menu provides the ability for further modification of the measurement parameters and additional input such as receiver, source, and power sensor match.
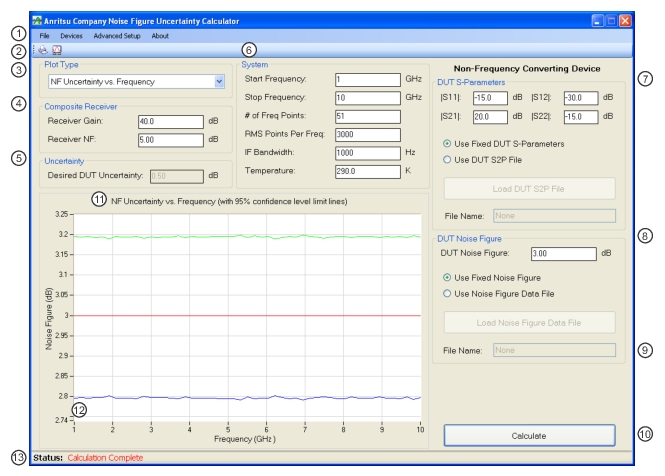
The figure below shows the various user configuration and calculation controls. A detailed control description is in the section following.
UNCERTAINTY CALCULATOR Dialog Box
1. Menu Bar selections for File, Devices, Advanced Setup, and About—Selection displays a drop-down menu or sub-dialog.
2. Icon Bar functions—Selection toggles between:
• Print Window dialog
• Markers—Activates user movable plot markers.
3. Plot Type—Select displays pull-down menu for:
• NF Uncertainty vs. Frequency
• NF Uncertainty vs. Gain
• Receiver Gain vs. Frequency
4. Composite Receiver Configuration Area
5. Uncertainty Configuration Area
6. System Configuration Area
7. DUT S-Parameters Area—Start of the Non-Frequency Converting device type controls.
8. DUT Noise Figure Area
9. Noise Figure Data File Name—If Use Noise Figure Data File is selected, file name appears here. A standard VectorStar TXT format file is required.
10. Calculate execute button
11. Graph Display Title—Determined by the selection in Plot Type.
12. Display Graph—Axis labels and range determined by user settings. Graph values change when Calculate button is selected.
13. Status Message—Shows calculator status such as “Calculation Complete” or “Calculation in Process”
Uncertainty Calculator Controls
The uncertainty calculator provides user interface (UI) controls in a Menu Bar, an Icon Bar, and in several dialog box areas.
Menu Bar Controls
• File—Drop-down menu provides selections for:
• Save Uncertainties—Saves the calculated uncertainty data as a TXT file.
• Print Window—Displays the standard print dialog for available printers.
• Save Window—Saves the current Uncertainty Calculator UI display as a PNG file.
• Preset—Clears the current user-defined configuration and resets all values to their default state.
• Exit
• Devices—Allows selection of device type as:
• Non-Frequency Converting—Select also configures the right side controls as Non-Frequency Converting Devices.
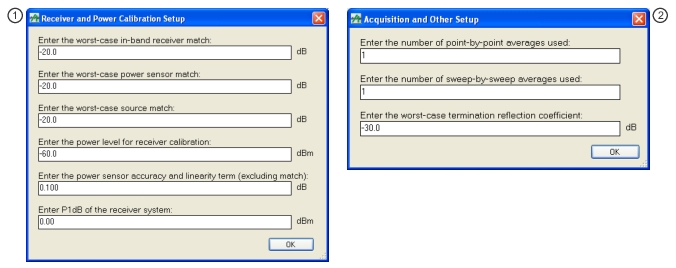
• Advanced Setup—Allows selection of advanced setup in sub-dialog boxes as:
• Receiver and Power Calibration Setup—Select displays the same named sub-dialog box as shown in the left side of Figure: Advanced Setup Sub-Dialog Boxes below.
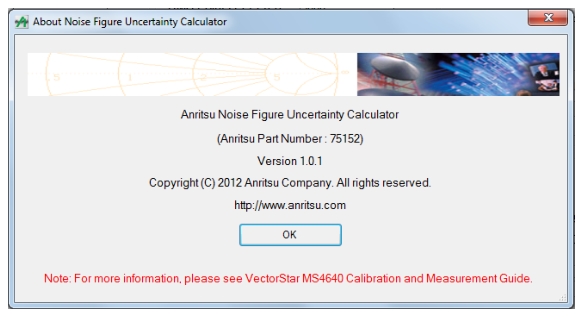
About Noise Figure Uncertainty Calculator Dialog Box
Icon Bar Controls
The Icon Bar provides two controls for fast access to print and marker functions:
• Print Icon—Select opens the Print Window dialog box to the default local or network printer. The output is sized to fit on standard A4/8.5 in × 11 in letter-sized paper.
• Marker Icon—Select toggles the plot marker on. The second selection toggles the markers off. If markers are moved and then turned off, turning them back on restores their previous positions.
Dialog Box Controls
These control descriptions are organized by the dialog box area name. Where noted, some controls are only present when the appropriate converting mode is selected.
Plot Type Area
A pull-down menu provides selection between:
• NF Uncertainty vs. Frequency—Display NF uncertainty as a function of frequency.
• NF Uncertainty vs. Gain—Display NF uncertainty as a function of DUT gain.
• Receiver Gain vs. Frequency—For a desired DUT NF uncertainty.
The plot type selection updates the label on the display graph after a calculation is performed.
Composite Receiver Area
Provides input configuration of the VNA plus additional user supplied components:
• Receiver Gain—Provides an input field for gain in dB. Typically used with multiple physical external amplifiers. Receiver Gain is unavailable if Receiver Gain vs. Frequency is selected in Plot Type.
• Receiver NF—Provides an input field for noise figure in dB. Typically dominated by the noise figure of the amplifier closest to DUT.
Uncertainty Area
Provides input of the Desired DUT Uncertainty in dB. Only available if the Plot Type above is set to Receiver Gain vs. Frequency.
System Area
Provides input configuration of the relevant VNA parameters:
• Start Frequency GHz
• Stop Frequency GHz—Stop Frequency must be greater than the Start Frequency.
• # of Freq Points—Number of Frequency Points between the Start and Stop Frequencies. Must be 2 points or greater.
• RMS Points Per Freq—Root Mean Square Points Per Frequency Point. Sets the number of measurement points to be used for each frequency points. For example, if the default of 51 frequency points is used with the default of 3,000 RMS Points, there will be 153,000 total measurements (51 × 3,000) used in the noise power computation.
• IF Bandwidth Hz—Should be the same as that used in the receiver calibration.
• Temperature K—Nominal temperature of the cold termination, defaults to 290K (17 ºC, 62.6 ºF), specified by the IEEE definition.
DUT S-Parameters Area
This control area is present if the Menu Bar | Devices parameter above is set to Non-Frequency Converting. Select allows the user to select between entering fixed data or using a previously loaded DUT S2P file.
• Use Fixed DUT S-Parameters—Select allows the user to define and apply fixed S-parameters located in the fields immediately above for: S11, S12, S21, and S22.
• Use DUT S2P File—Select allows the user to load a previously stored S2P DUT file. If selected, the Load DUT S2P File button and the File Name field become available. Select the button and navigate to the previously stored S2P file. When complete, the loaded file name appears in the File Name field.
DUT Noise Figure Area
This control area is present if the Menu Bar | Devices parameter above is set to Non-Frequency Converting. Select allows the user to select between entering fixed data or loading measured data.
• Use Fixed Noise Figure Data—Select allows the user to define and apply a fixed DUT Noise Figure value defined in the field immediately above.
• Use Noise Figure Data File—Select allows the use to load a previously stored noise figure data file in standard VectorStar TXT format. If selected, the Load Noise Figure Data File button and the File Name field become available. Select the button and navigate to the previously stored data file. When complete, the loaded file name appears in the File Name field.
Calculate Button
Select starts the calculation after all parameters are entered. The status message at the bottom changes to Calculation in Progress. The button name changes to Abort where selection stops the calculation and returns the status to Calculation Complete. Once the calculation is complete, the display graphs and axis labels are updated and the status changes to Calculation Complete.
Typical Uncertainty Calculator Use Procedure
1. Select plot type. The plot type selection activates the required fields and controls.
2. Setup system and input device parameters.
3. Plot uncertainties by selecting the Calculate button.
4. If uncertainty improvements are needed, modify the IFBW and # of RMS Points to verify that the current receiver gain and noise figure are adequate for the desired measurement uncertainty.
5. If further improvement is needed, adjust the gain of the receiver to determine if adding additional preamps will reach the objective.
6. Alternatively, enter the desired uncertainty and compute the required receiver parameters.
7. As required, activate and place markers at frequencies of interest.
• On the Icon Bar, select the Marker icon.
• A marker is available for each displayed trace.
• Drag the marker to the position of interest and read off the axis values.
8. As required, print display graph as a PNG file.
9. As required, save uncertainty output as a TXT or CSV file.