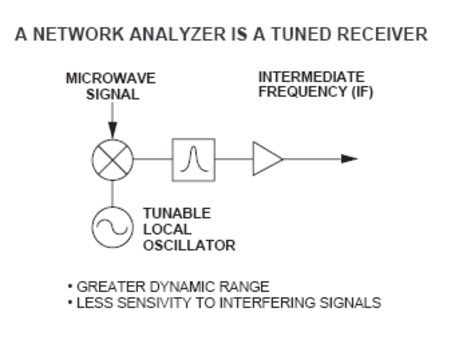
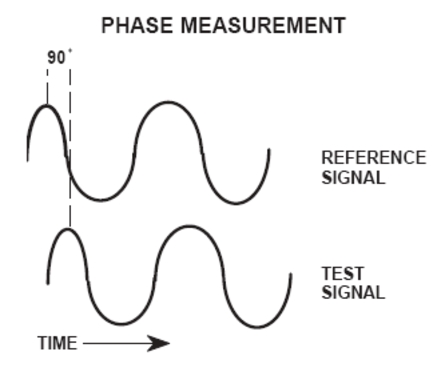
The vector network analyzer is a tuned receiver (Figure: Network Analyzer as a Tuned Receiver). The microwave signal is down converted into the pass band of the IF. To measure the phase of this signal, we must have a reference to compare it with. If the phase of a signal is 90 degrees, it is 90 degrees different from the reference signal (Figure: Signals with a 90 Degree Phase Difference). The network analyzer would read this as –90 degrees, since the test signal is delayed by 90 degrees with respect to the reference signal.
Split Signal where a Length of Line Replaces the DUT
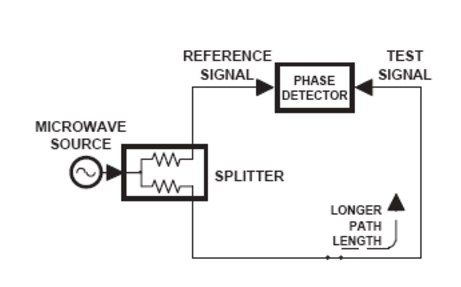
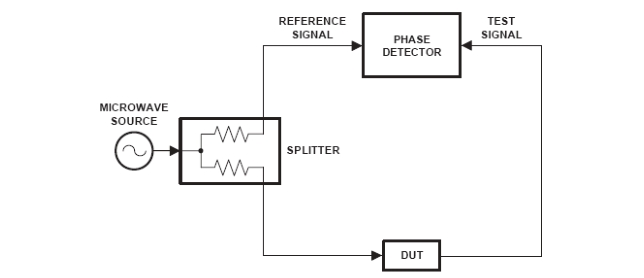
Splitting the Microwave Signal
The phase of the microwave signal after it has passed through the device under test (DUT) is then compared with the reference signal. A network analyzer test set automatically samples the reference signal, so no external hardware is needed.
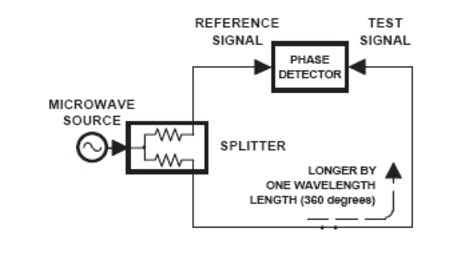
Let us consider for a moment that you remove the DUT and substitute a length of transmission line (Figure: Split Signal where a Length of Line Replaces the DUT). Note that the path length of the test signal is longer than that of the reference signal. Now let us see how this affects our measurement.
Split Signal where Path Length is Different by Exactly One Wavelength
Assume that we are making a measurement at 1 GHz and that the difference in path-length between the two signals is exactly 1 wavelength. This means that test signal is lagging the reference signal by 360 degrees (Figure: Split Signal where Path Length is Different by Exactly One Wavelength).We cannot really tell the difference between one sine wave maxima and the next (they are all identical), so the network analyzer would measure a phase difference of 0 degrees.
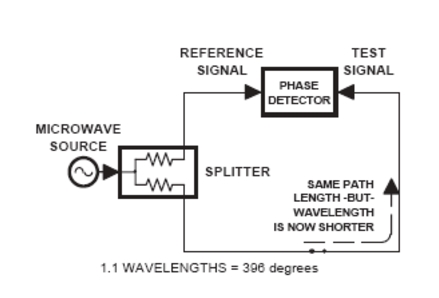
Now consider that we make this same measurement at 1.1 GHz. The frequency is higher by 10 percent so therefore the wavelength is shorter by 10 percent. The test signal path length is now 0.1 wavelength longer than that of the reference signal (Figure: Split Signal where Path Length is Longer than One Wavelength). This test signal is:
1.1 X 360 = 396 degrees
This is 36 degrees different from the phase measurement at 1 GHz. The network analyzer will display this phase difference as –36 degrees. The test signal at 1.1 GHz is delayed by 36 degrees more than the test signal at 1 GHz.
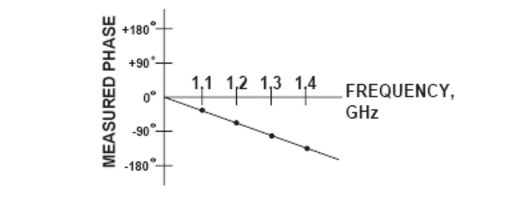
You can see that if the measurement frequency is 1.2 GHz, we will get a reading of –72 degrees, –108 degrees for 1.3 GHz, etc. (Figure: Electrical Delay). There is an electrical delay between the reference and test signals. For this delay we will use the common industry term of reference delay.
You also may hear it called phase delay. In older network analyzers you had to equalize the length of the reference arm with that of the test arm to make an appropriate measurement of phase vs. frequency.
To measure phase on a DUT, we want to remove this phase-change-vs.-frequency due to changes in the electrical length. This will allow us to view the actual phase characteristics. These characteristics may be much smaller than the phase change due to electrical length difference.
Split Signal where Path Length is Longer than One Wavelength
Electrical Delay
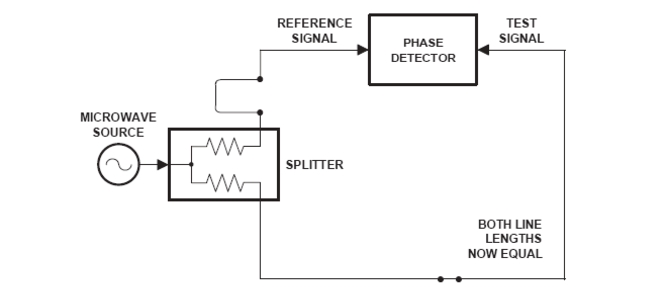
There are two ways of accomplishing this. The most obvious way is to insert a length of line into the reference signal path to make both paths of equal length (Figure: Split Signal where Paths are of Equal Length).With perfect transmission lines and a perfect splitter, we would then measure a constant phase as we change the frequency. The problem using this approach is that we must change the line length with each measurement setup.
Split Signal where Paths are of Equal Length
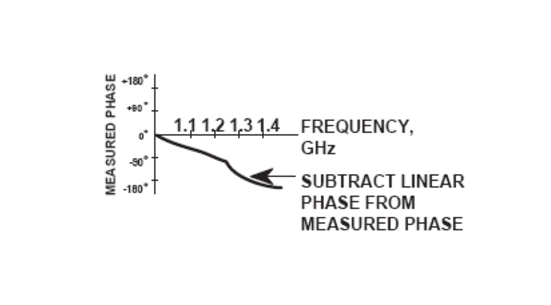
Another approach is to handle the path length difference in software. Figure: Phase Difference Increases Linearly with Frequency displays the phase-vs.-frequency of a device. This device has different effects on the output phase at different frequencies. Because of these differences, we do not have a perfectly linear phase response. We can easily detect this phase deviation by compensating for the linear phase. The size of the phase difference increases linearly with frequency so we can modify the phase display to eliminate this delay.
Phase Difference Increases Linearly with Frequency
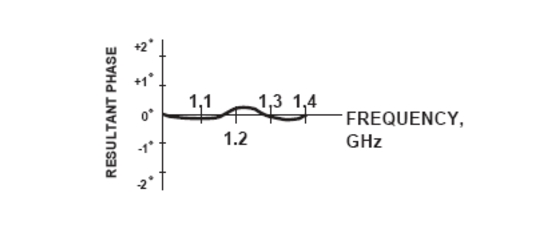
The VectorStar MS464xB Series VNA offers automatic reference delay compensation with the push of a button. Figure: Resultant Phase with Path Length shows the resultant measurement when we compensate path length. In a system application you can usually correct for length differences; however, the residual phase characteristics are critical.
Resultant Phase with Path Length
Now let us consider measuring the DUT. Consider a two port device; that is, a device with a connector on each end. What measurements would be of interest?
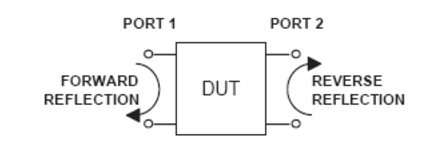
First, we could measure the reflection characteristics at either end with the other end terminated into 50‑ohms. If we designate one end as the normal place for the input that gives a reference, we can then define the reflection characteristics from the reference end as forward reflection, and those from the other end as reverse reflection (Figure: Forward and Reverse Measurements).
Forward and Reverse Measurements
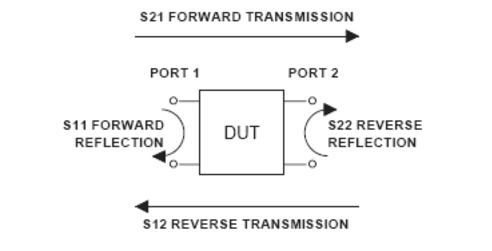
Second, we can measure the forward and reverse transmission characteristics. However, instead of saying “forward,” “reverse,” “reflection,” and “transmission” all the time, we use a shorthand. That is all that S-parameters are, a shorthand! The “S” stands for scattering. The second number is the device port that the signal is being injected into, while the first is the device port that the signal is leaving. S11, therefore, is the signal being injected into port 1 relative to the signal leaving port 1. The four scattering parameters (Figure: S-Parameters) are:
• S11: Forward Reflection
• S21: Forward Transmission
• S22: Reverse Reflection
• S12: Reverse Transmission
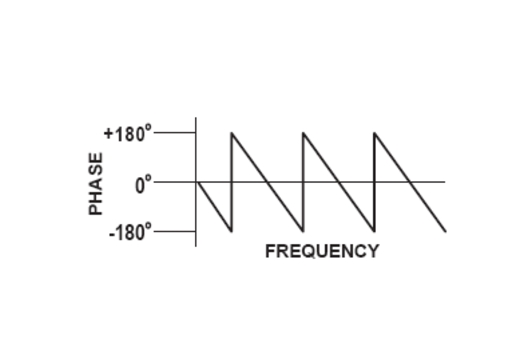
S-parameters can be displayed in many ways. An S-parameter consists of a magnitude and a phase. We can display the magnitude in dB, just like a scalar network analyzer. We often call this term log magnitude. We can display phase as “linear phase” (Figure: Linear Phase with Frequency Waveform). As discussed earlier, we cannot tell the difference between one cycle and the next. Therefore, after going through 360 degrees, we are back to where we began. We can display the measurement from –180 to +180 degrees. The –180 to +180 degree approach is more common. It keeps the display discontinuity removed from the important 0 degree area used as the phase reference.
S-Parameters
Linear Phase with Frequency Waveform
There are several ways in which all the information can be displayed on one trace.