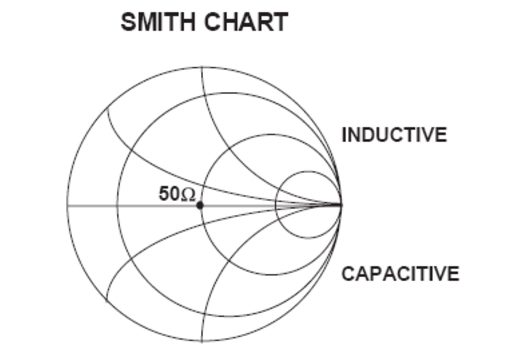
The complex conjugate is best analyzed using a Smith Chart (Figure: Smith Chart), which is a plot of r and x. To display all the information on a single S-parameter requires one or two traces, depending upon the format we want. A very common requirement is to view forward reflection on a Smith Chart (one trace) while observing forward transmission in Log Magnitude and Phase (two traces). Let us see how to accomplish this in the VectorStar MS464xB Series VNA.
Smith Chart
The VectorStar MS464xB Series VNA has 16 channels and each channel can display a complete S-parameter in any format on up to 16 traces. All four S-parameters can be seen simultaneously in any desired format. A total of 16x16 traces can be viewed at the same time. While this is a lot of information to digest, the large color display of the VectorStar MS464xB Series VNA makes recognizing and analyzing the data surprisingly easy.
Another important parameter we can measure when phase information is available is group delay. In linear devices, the phase change through the DUT is linear-with-frequency. Thus, doubling the frequency also doubles the phase change. An important measurement, especially for communications system users, is the rate of change-of-phase-vs.-frequency (group delay). If the rate of phase-change-vs.-frequency is not constant, the DUT is nonlinear. This nonlinearity can create distortion in communications systems.
Measurement Error Correction
Since we can measure microwave signals in both magnitude and phase, it is possible to correct for six major error terms:
• Source Test Port Match
• Load Test Port Match
• Directivity
• Isolation
• Transmission Frequency Response
• Reflection Frequency Response
We can correct for each of these six error terms in both the forward and reverse directions, hence the name 12-term error correction. Since 12-term error correction requires both forward and reverse measurement information, the test set must be reversing. “Reversing” means that it must be able to apply the measurement signal in either the forward or reverse direction.
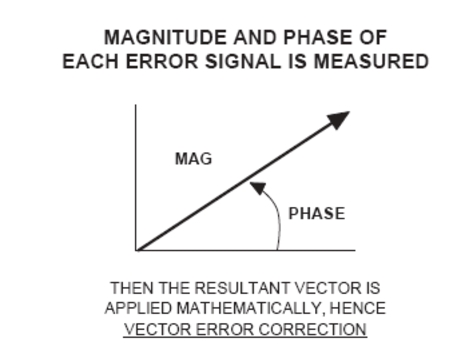
Magnitude and Phase
To accomplish this error correction, we measure the magnitude and phase of each error signal (Figure: Magnitude and Phase). Magnitude and phase information appear as a vector that is mathematically applied to the measurement signal. This process is termed vector error correction.