VectorStar™ MS464xB Series Microwave Vector Network Analyzer Operation Manual : User Interface Display : User Interface Main Screen
 
User Interface Main Screen
User Interface - Single Channel - Four Traces - Frequency Menu
 
User Interface Control and Display Areas
The entire instrument main display is a touch screen that can be manipulated by touching, or by clicking with an attached USB mouse. The figure below shows the general display areas for a single channel displaying four graphical traces.
Note 
When using the touch screen, a recommended best practice is to use a positive hard press to make sure the required setting in input into the system. A light touch may not change the instrument setting as required.
To recalibrate the touch screen, navigate to the CALIBRATE TOUCH SCREEN dialog box located at MAIN | System | SYSTEM | Utility | UTILITY | Calibrate Touch Screen | TOUCH SCREEN CONTROL PANEL dialog box. The procedure is described in the
User Interface Reference Manual.
A detailed touch screen calibration and adjustment procedure is described in the VectorStar MS464xB Series VNA Maintenance Manual.
User Interface Display Areas (1 of 2)
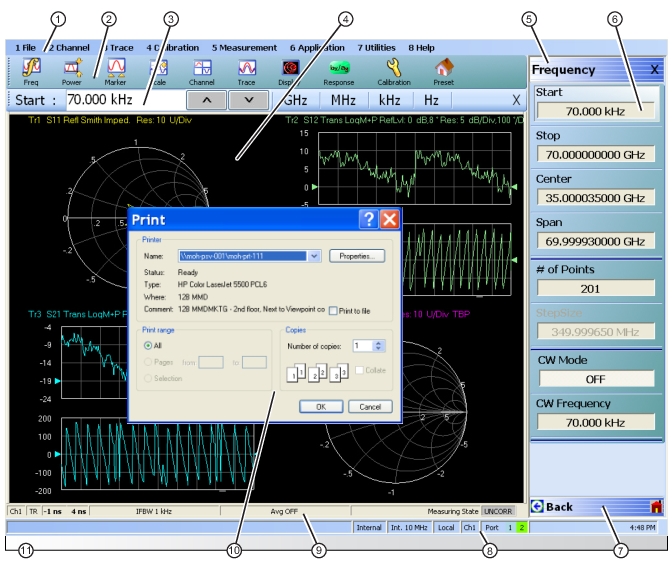
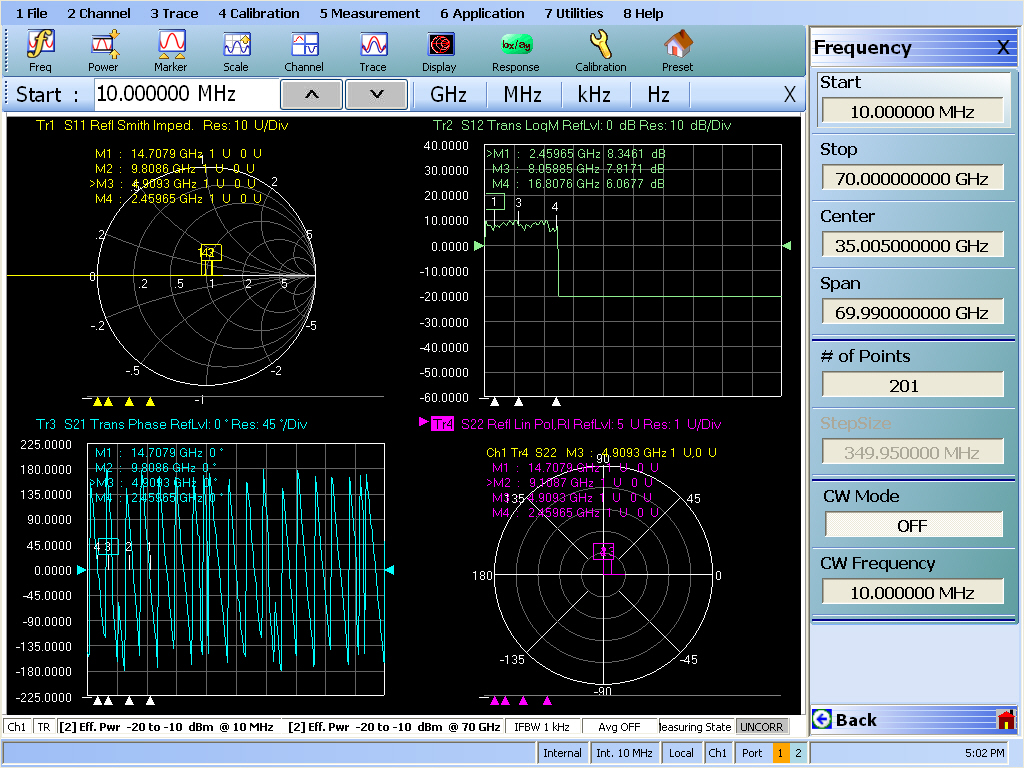
1. Menu Bar – Displays eight (8) drop-down menus: File, Channel, Trace, Calibration, Measurement, Application, Utilities, and Help.
2. Icon Toolbar – User-configured with up to 10 user-selected quick access icons.
3. Field Toolbar – Appears only when field button is clicked for input. Display field for value, with one or more units (such as dB, dBm, or Hz), an Enter button, and an X close button.
4. Display Area – Displays from one to 16 channels. Each channel can have from one to 16 trace display graphs. Each trace display can optionally have from one to 12 markers, a reference marker, and an upper and lower limit line.
5. Menu Title – Displays the name of the displayed right-side menu. Menu titles are unique to each menu.
6. Menu Buttons – The menu buttons allow the user to set parameters, make configuration selections, read result values, start processes, toggle between two or more values, display sub-menus, and display dialog boxes.
7. Menu Navigation Buttons – The navigation buttons always appear at the bottom of the right-side menu and allow browser-like forward and backward navigation through the user’s history. Back returns to previous selected higher-level menu, Next returns to a previously selected lower-level menu), and Home returns to the Main Menu.
8. System Status Bar – Displays status messages, and configuration status that affects the entire instrument.
9. Channel Status Bar – Provides status for each channel display near the bottom of the screen. If multiple channels are displayed, there is a separate status bar for each channel display.
10. Dialog Box Display Area – Most dialog boxes, whether from the VNA or from the underlying operating system, appear in the center of the display area.
11. Tableau Data Display/Input Area – The tableau area only appears when the appropriate menu button is selected. When selected, the display shrinks upwards and the tabular data area expands.
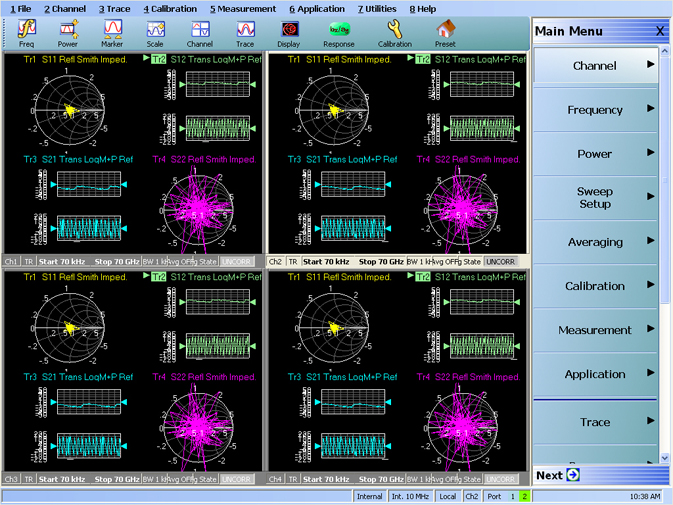
For all VectorStar VNA models, if the instrument is in 25,000 point mode, multiple channels can be selected by the user. For the VectorStar MS464xB Series VNA, in 100,000 point mode, the instrument is limited to one channel. Each available channel can have up to 16 graphical traces. The figure below shows an instrument setup with four channels, each with four traces. The channel and trace display layout shown below is user-defined as a 2 × 2 configuration for channels and traces.
Four Channels – Each channel with Four Traces –16 Total Traces
Function Access
The VectorStar MS464xB Series VNA provides multiple methods to access the menus and functions that include:
Front panel keys
Attached USB mouse
Attached USB keyboard
Display touch screen
Each of the methods above can manipulate the instrument through the five major user interface areas on the main display:
The top MENU BAR with its drop-down menus and menu commands.
The ICON TOOLBAR with up to 10 single-click functions, available as a default configuration or as a user-definable configuration of icon functions.
The right side APPLICATION MENU system that provides access to over 100 function menus, sub-menus, dialog boxes, and configuration options.
For some parameters, selecting a button displays a FIELD TOOLBAR that appears just below the icon toolbar allowing input of parameter values and units.
For some parameters, selecting a button displays a CONFIGURATION or SETUP TABLEAU below the main display area for input of complex parameter sets such as segmented frequency or power sweeps.
To Select a Channel
1. To select a channel in a multi-channel display, do one of the following:
Click anywhere inside the desired channel box.
From the keyboard, ALT + 2 then 7 to view the previous channel or ALT + 2 then 8 to view the next channel.
On the top menu bar, select MENU BAR | Channel | Channel Prev or MENU BAR | Channel | Channel Next.
On the right side menu, select MAIN | Channel | CHANNEL | Chan Next or Chan Previous.
2. The selected channel border changes from gray to white. Figure: Four Channels – Each channel with Four Traces –16 Total Traces shows Channel 2 (Ch2) selected.
Note 
The Ch->Max, Ch->Next, and Ch-Prev icons are available for the icon toolbar. These icons provide one click access to channel maximum, channel next, and channel previous functions. They can be added to the icon toolbar for a custom configuration and saved as part of a preset configuration.
To Maximize a Channel Display
1. Use one of the methods above to select the desired channel.
2. Do one of the following to maximize the selected channel:
From the keyboard, enter CTRL + 1 or ALT + 2, then 6.
On the main display, double-click on the channel border box.
On the top menu bar, select MENU BAR | Channel | Channel Max
On the right side menu, select MAIN | Channel | CHANNEL | Chan. Max
3. The selected channel now fills the display area.
Maximize a channel display to review the channel status information at the bottom of its screen.
To Make the Display Area Larger
1. The top icon toolbar and the right side menus can be removed to make the display area larger.
2. Remove the icon toolbar by doing one of the following:
From the keyboard, select ALT + 7 then 2.
On the top menu bar, select MENU BAR | Utilities | Toolbar Off.
3. The icon toolbar disappears. Repeat Step #2 to make the icon toolbar re-appear.
4. Remove the right side menus by doing one of the following:
From the keyboard, enter ALT + 7 then 7.
On the top menu bar, select MENU BAR | Utilities | Clear.
5. The right side menu disappears. Repeat Step #4 to make the menu re-appear.
To Select Traces within a Channel
1. Use one of the methods above to maximize the channel display.
2. To select a trace in a multi-trace display, do one of the following:
With a mouse, single click the trace title.
If you double-click either the trace title or anywhere within the trace, the trace is both selected and maximized.
From the keyboard, enter ALT + 3 then 7 to view the previous trace or ALT + 3 then 8 to view the next trace.
On the top menu bar, select MENU BAR | Trace | Trace Prev or MENU BAR | Trace | Trace Next.
On the right side menu, select MAIN | Trace | TRACE | Trace Previous or Trace Next.
The selected trace number is highlighted and a left arrow appears.
Trace Selection Indicator
f
Trace 1 Selected
Trace 1 Not Selected
 
Note 
The Tr->Max, Tr->Next, and Tr->Previous icons are available for the icon toolbar. These icons provide one click access to trace maximum, trace next, and trace previous functions. They can be added to the icon toolbar for a custom configuration and saved as part of a preset configuration.
To Maximize a Trace Display
1. Use one of the methods above to select the desired trace.
2. For a maximum display, make sure the trace’s channel is maximized.
3. Do one of the following to maximize the selected trace:
From the keyboard, select ALT + 3, then 6.
On the main display, double-click anywhere in the trace display.
On the top menu bar, select MENU BAR | Trace | Trace Max.
On the right side menu, select MAIN | Trace | TRACE | Trace Max.
4. The selected trace now fills the display area.
Maximize a trace display to review the trace status information at the bottom of trace screen.
5. Repeat the actions above to return the trace to its normal size.