From Source Locator TDOA Settings and Control panel, click Start Data Collection. The TDOA Settings & Control window appears in the Source Locator screen as shown in Figure: TDOA Settings & Control Window.
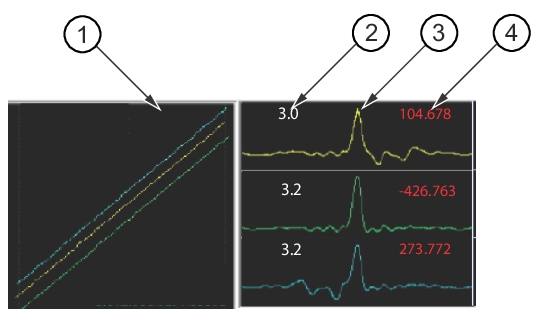
TDOA Settings & Control Window
1. IQ Linearity Alignment View
2. Correlation Ratio
3. TDOA IQ Signal Correlation View
4. Correlation Offset
Start Data Collection
Executes the TDOA measurement. New TDOA results are only averaged when the Correlation Ratio is higher than 30. Click to end data collection.
TDOA checks if Vision Acquire is sweeping on the same PC and using the same database. This dialog action statement appears:
"Vision Acquire is sweeping on the same database. Do you want to pause Vision Acquire and continue?"
• If Yes is selected, Vision Acquire stops sweeping until the TDOA measurement is done, then resumes. Also, this answer is remembered for as long as the TDOA measurement window is open.
• If No is selected, then no TDOA measurement is done.
Note
If another process or another PC is accessing the probes, this cannot be detected and a conflict may occur.
The Correlation Results box shows the averaged distance in meters, and the number of averages used. The number of averages can be different for each set of probes because the correlation ratio may sometimes be too low for a particular probe pair.
Wait for Signal Peak
When selected, two events occur:
• The program waits until the power level on the first probe is within 10 dB of the reference level before the I/Q acquisition begins.
• After the I/Q data is acquired, it looks to see if there is dead time in the data set where the signal is missing. This dead-time is removed before the correlation is performed.
Automatically Reference Levels
When this is checked, Vision will do a 20 sweep max-hold RF trace capture to determine the optimal reference level setting. It is important to use a reference level that is near the peak amplitude of the signal that is being sought. This maximizes the dynamic range and gives much better I/Q sample points. If the reference level is set too high, the I/Q plot will not fill in solid, but instead the points will appear in distinct rows and columns. This is equivalent to using a much lower bit resolution.
Average Distances
Each time a TDOA I/Q capture is done, the distance result will be averaged with previous measurements. The resulting average values are shown along the line to the right of this check box. Checking the Average Distance (meters) check box causes the average values to be used when drawing the arcs on the map and locating the RF source. If the check box is clear, then the most recent measurement values will be used on the map, rather than the average values.
The values shown in the Averages look different. For example: -5519 (2). The first number (-5519) is the averaged value taken from the Correlation Offset (meters) field above. The number in parenthesis (2) is the count of values used in the average. This can be a different number for each probe pair, depending on the Correlation Ratios from each measurement.
X
This button will clear the averages. This should be done if you change which probes are being used, or if you change the frequency of the source you are looking for.