 |
|
Icon | Description |
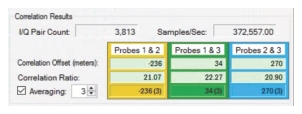
I/Q Pair Count Displays the I/Q Pair Count | |
Samples/Sec Displays the number of samples per second | |
Correlation Offset (meters) The values shown in the Averages look different. For example: The yellow box averaging display of –236 (3). The first number is the averaged value taken from the Correlation Offset (meters) field above. The number in parenthesis is the count of values used in the average. This can be a different number for each probe pair, depending on the Correlation Ratios from each measurement. | |
Correlation Ratio The Correlation Ratio is the peak amplitude divided by the average value of the correlation function. A value less than 20 means you should not trust the results at all, while a value above 100 is usually a strong indication that the correlation is good. | |
Averaging Click the Averaging check box to initiate averaging for each time a TDOA I/Q capture is done. Type or select the amount of averages. The measured distance is averaged with previous measurements. The average values are used when drawing the arcs on the map and locating the RF source. If the check box is clear, then the most recent measurement values will be used on the map, rather than the average values. | |
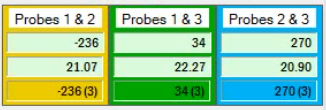 | Probe Block The probe combinations blocks and the numeric boxes are colored for quick visual separation. • Yellow, dark green, blue for each probe combination corresponds to the hyperbolic lines drawn on the map. • Lighter green background in the numeric boxes indicate the measurement is good. • Lighter red in the numeric boxes indicate the correlation ratio is too low (<5) or if the probe correlation is greater than the probe separation. • Any number of the numeric boxes can be either green background or red background, depending on the value it displays. |