When enough data has been collected to generate the report, open the Occupancy Report Generator. This is a separate window that opens, allows for some customization, and viewing of the report content.
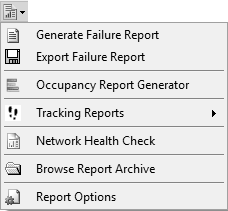
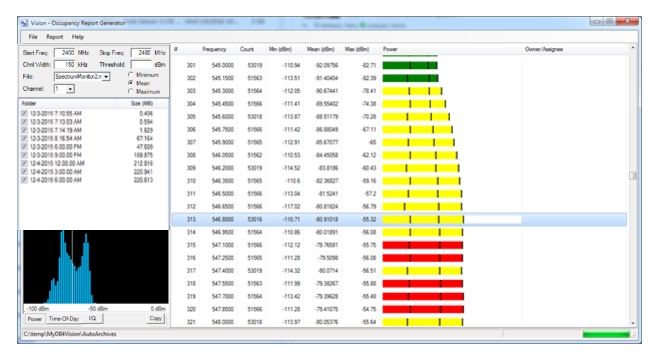
2. Click Occupancy Report Generator in the menu list. The Vision Occupancy Report Generator window opens as shown in Figure: Occupancy Report.
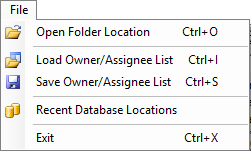
Occupancy Report Generator works with auto-archived databases or manually created Vision database. Specify the folder location that holds the desired database. Auto-archived databases are stored in a sub-folder of the active database folder. Each archived database has its own sub-folder, named with the date and time stamp at which the archive was created. The databases will be listed on the left side of the report generator window. Each folder is listed by name, and there is a check box next to the folder names to include or exclude particular folders in the generated report.
Occupancy Report Generator– Open Folder Location
3. Set the desired frequency range, channel width, and power threshold level. The report includes a pass/fail status for each sub-channel.
• If the maximum power measured in a sub-channel is below this threshold, the channel passes, and the power bar in the report is green.
• If the maximum power exceeds the threshold, but the average power is below the threshold, then the power bar is yellow.
• If the mean power across all saved traces in a given sub-channel is above the threshold, then the power bar is red.
The power bar for each sub-channel shows three black lines. The first is the minimum power measured, the second is the mean power, and the third is the maximum power measured for the given sub-channel.
Generating the Report
To generate the Occupancy Report, click Generate from the Report menu on the main menu bar. You can also press F5 as a shortcut to generate the report. It may take several seconds to generate the report, depending on the number of traces and archive folders being processed. There can be a lot of data to process. The lower right-hand corner of the window has a progress bar that indicates the progress through the selected archive databases.
Occupancy Report
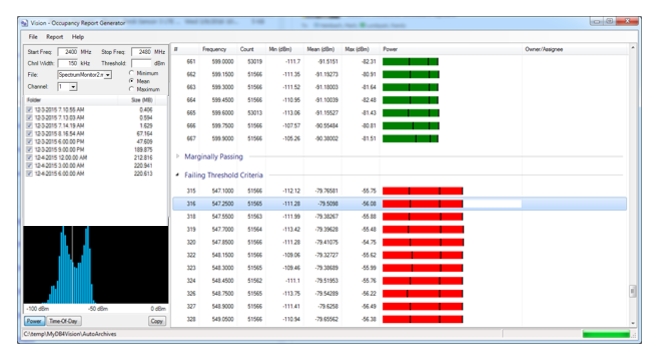
Normally, the report will show the sub-channels in frequency order. There is an option to group the sub-channels by pass/fail status. To do so, click to toggle Show By Pass/Fail Status menu item under the Reports main menu. The figure below shows the report window where the sub-channels are grouped by Pass/Fail status. In Figure: Occupancy Report Sorted Pass/Fail, Marginally Passing Section Collapsed the Marginally Passing monitors are currently hidden.
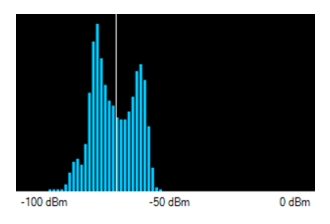
Below the folder list in the lower-left corner of the program window there is a graph that will show either a histogram of the power at the selected sub-channel, or a histogram showing the time-of-day power readings for the selected sub-channel. In Figure: Time-of-Day Power Histogram of Selected Sub-Channel notice the gray shading. The shading indicates there is no data available at those times. If it is black, no shading and no bar, then there are traces at those time, but everything was below threshold. You can toggle between these two views with the Power and Time Of Day buttons below the graph. There is also a Copy button that will place the graph onto the Windows Clipboard.