Vision™ MX280001A Spectrum Monitoring Application Software : File Viewer : Password Protection
 
Password Protection
Password protection is available in Remote Spectrum Monitor view. In cases where multiple users are viewing a file set, only the administrator retains the rights to delete the remote files when they are downloaded. When the delete button is inactive, it is grayed and not available to users. Therefore, protected target receiver files can be archived for future reference.
Delete Button
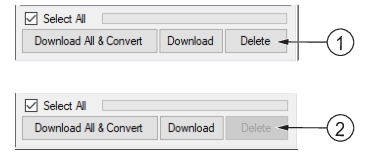
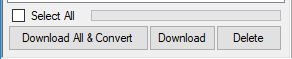
1. Delete Active
2. Delete Inactive
To make the Delete button inactive and unavailable, select the Lock Remote File Delete command from the File Viewer. The first time this command is selected, the Enter Password dialog is displayed as shown in Figure: Enter Password. Type a password and click OK. The Delete button becomes unavailable to other users.
Enter Password
To unlock the Delete button, click the File Viewer logo to show the menu list as shown in Figure: Unlock Delete. Click Unlock Remote File Delete.
Unlock Delete
The Delete button becomes active as shown in Figure: Delete Unlocked. . Files can be selected and deleted by all users.
Delete Unlocked
Local Measurement Folder
The Log Measurement Folder view is shown in Figure: Remote Spectrum Monitor View.
Remote Spectrum Monitor View
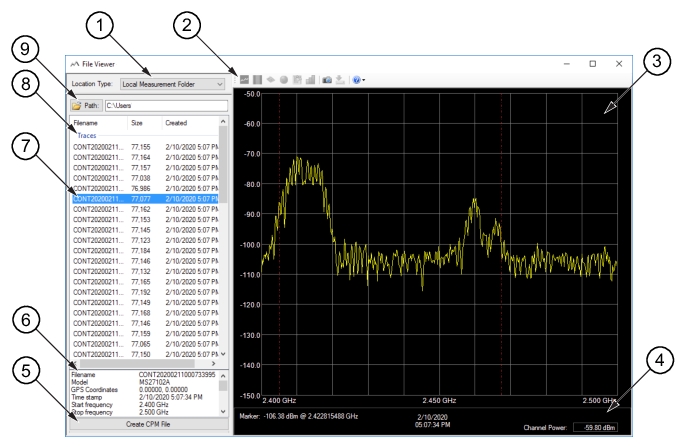
1. Local Measurement Folder
2. Toolbar
3. RF Sweep Screen
4. Status
5. Create CPM File Button
6. Target Receiver Details
7. User Selected File
8. File Folder Window
9. File Browse
Local Measurement Folder
User selected view. Click or type a path to navigate to the folder that contains target receiver files.
Toolbar
Not active in Local Management view
RF Sweep Screen
Shows the selected target receiver file RF sweep view.
Status
Shows the RF sweep date and time collected, Channel Power, Marker and Delta Marker details when the markers are active.
Create CPM File Button
Converts the target receiver file to a CPM file
Target Receiver Details
Displays the target receiver details of the selected file.
User Selected File
Click highlights the target receiver file to view.
File Folder Window
Displays the files of the opened target receiver folder.
File Browse
Click to browse or type a path to locate the folder which contains supported measurement files.
CPM Measurement File
The CPU Measurement File view is shown in Figure: Hardware Probe View.
CPM Measurement View
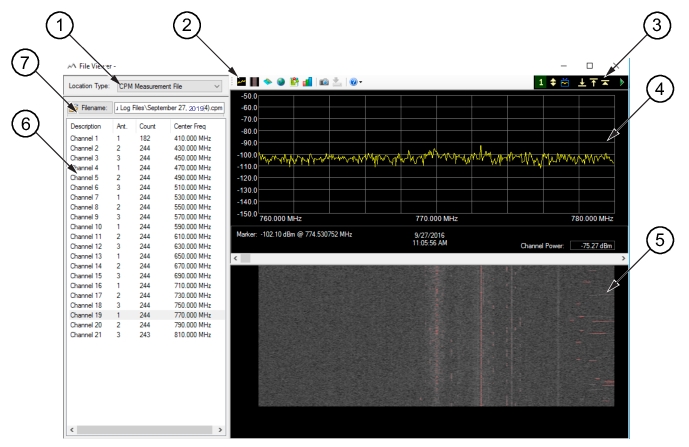
1. CPM Measurement View
2. Toolbar
3. Trace View Buttons
4. Sweep Window
5. Spectrogram Window
6. File Log
7. Filename Browse
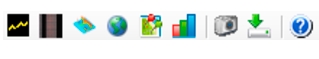
CPM Measurement View
User selected view. Two windows will be displayed to view the CPM file – trace view and spectrogram view.
Toolbar
Active in CPM Measurement File view. For toolbar button details, see File Viewer Toolbar,
Trace View Buttons
Usable in CPM Measurement File mode. For description of each, see Table: Trace View Buttons.
Sweep Window
Shows the RF sweep view of the selected CPM file.
Spectrogram Window
Shows the Spectrogram view of the selected CPM file.
File Log
Shows the files staged in the opened folder.
Filename Browse
Browse to locate the CPM files catalog.
File Viewer Toolbar
The File Viewer toolbar provides measurement viewing preferences. The toolbar shown in Figure: File Viewer Toolbar is only available for the Location Type – CPM Measurement File.
File Viewer Toolbar
The File Viewer icon buttons and their description is listed in Table: Email Status Icons.
Email Status Icons
Icon
Description
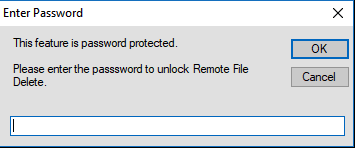
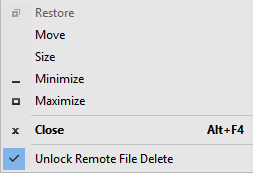
File Viewer
This icon is located at the top-left corner of the Source Locator GUI screen. Right-click displays the following menu.
Restore: Resets the GUI display to the default view. This selection is active only after Maximize has been selected and the GUI screen is in a full screen mode. Restore is normally grayed and only becomes available after Maximize is active.
Move: Move the GUI display screen.
Size: Click a corner of the GUI display and resize the display by dragging the corner.
Minimize: Minimizes the screen to the bottom tray, but remains active. Click it from the tray to view the GUI display.
Maximize: Click changes the GUI screen to full size.
Close: Closes the GUI screen display.
Trace View
Click provides Trace View only display.
View Trace and Spectrogram
Splits the Viewing display into Trace View and Spectrogram View.
3-D Spectrogram
Click provides 3-D Spectrogram display.
Probe map
Click provides a map overview and a Locator of the trace probe. Floating the mouse over the indicator provides the host name of the probe.
Breadcrumbs Map
Power vs Time
Click provides a bar graph representation of the power vs. time of the selected traces. To set markers and view time stamp, see Power vs Time Markers.
Snap Shot
Click provides Trace View only display.
Export
Click to Export coverage mapping details to KML file.
Help
Click provides the Help menu.
 
Trace View Buttons
The Trace View toolbar is located at the top right corner of the trace display. The trace view buttons shown in Figure: Trace View Toolbar provide trace sweep viewing options.
Trace View Toolbar
The Trace View buttons are described in Table: Trace View Buttons.
Trace View Buttons
Icon
Description
Single Trace
Default view showing only one trace, the last measurement trace taken. See Figure: Trace Views.
Density Plot
Live Trace View
A live trace view of a target receiver. Click displays the dialog below. Type the host name of the target receiver to view, enter many Antenna Ports, and click Ok. The antenna port number may not be relevant for the target receiver in use, however, the option is available for users with multi-port target receivers. File Viewer updates the sweep trace once per second.
Min Hold Trace
Shows the cumulative minimum value of each display point over many trace sweeps. Can be applied to only one channel probe in the database. See Trace Views.
Max Hold Trace
Shows the cumulative maximum value of each display point over many trace sweeps. Can be applied to only one channel probe in the database. See Trace Views.
Average Hold Trace
Shows an exponential average of a number of traces, determined by the number of Averages. Can be applied to only one channel probe in the database. See Trace Views.
Start / Stop
Click starts or stops the trace sweep.
Trace Views
Figure: All Traces View shows a Single Trace view with Max Trace, Min Trace, and Average Trace active.
All Traces View
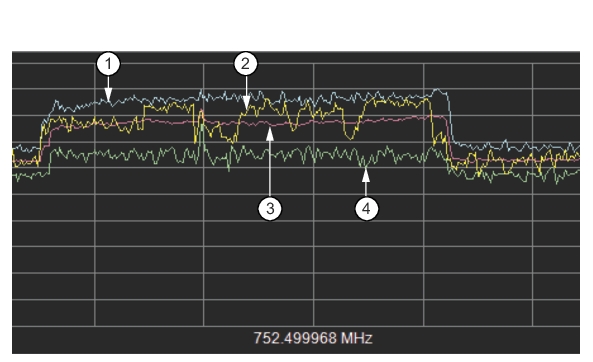
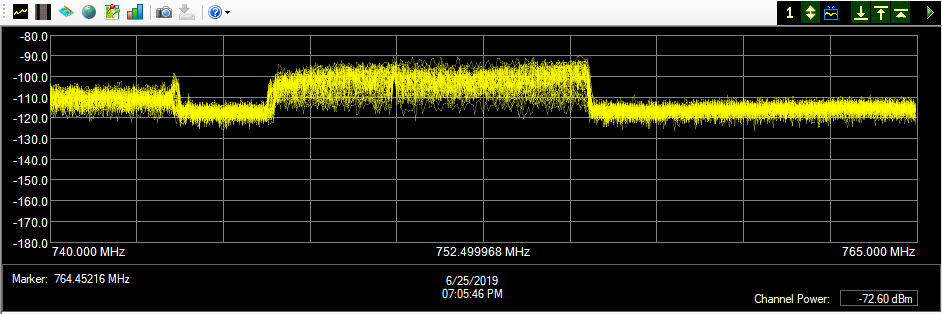
1. Max Hold Trace (Light Blue)
2. Single Trace (Yellow)
3. Average Trace (Magenta)
4. Min Hold Trace (Light Green)
Figure: Density Plot shows the density plot of the Single Trace shown in Figure: All Traces View. The plot displays all the single target receiver sweep traces saved and then superimposed in one display.
Density Plot