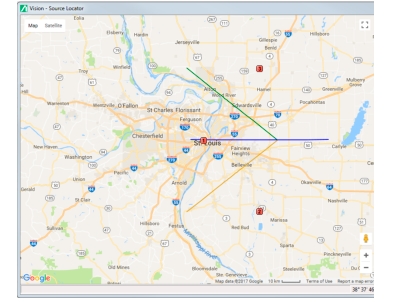
In Figure: Target Receiver Lines, there are three intersection points designated by the green squares with a star. One is inside the triangle, near monitor 1. Here the lines approach each other at large angles and an uncertainty of say 50 meters in each line position produces a similar uncertainty in the intersection point. However, the true source was the one located in the upper left-hand of the image. In this case the lines actually are within 50 meters of each other for a distance of almost 500 meters.
Target Receiver Lines
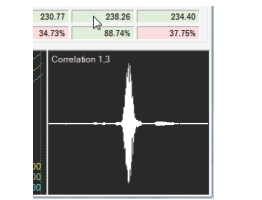
The TDOA Settings & Control window will show some results that help in judging how much confidence to have in a given set of data, and in the results produced. The last two lines of the results section contain the Correlation Ratio and IQ Similarity.
Correlation Ratio
The Correlation Ratio is a number that relates to how strongly the algorithm was able to find the correct time alignment offsets. The correlation peaks at the position where the two sets of IQ data are aligned in time. If this peak is very pronounced, then you can have confidence in the time alignment. If it is not so pronounced, then the data is suspect. Basically, the Correlation Ratio is the peak amplitude divided by the average value of the correlation function. A value less than 20 means you should not trust the results at all, while a value above 100 is usually a strong indication that the correlation is good.