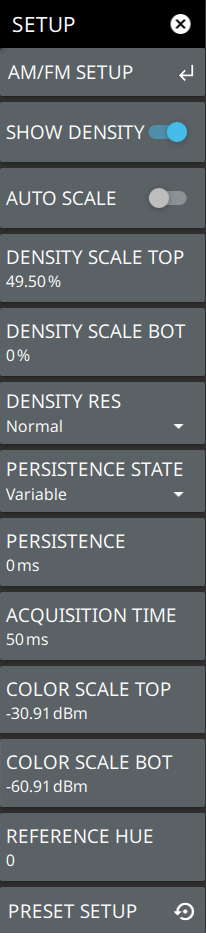
AM/FM SETUP Available when Option 24 is installed. Opens the SETUP Menu (AM/FM Audio). SHOW DENSITY Toggles the density display on or off. Density displays the relative time density of a signal in a color scale ranging from blue to red. Signals that persist longer or more often during the acquisition time are indicated in red color. Brief transient signals are shown in blue color. AUTOSCALE When toggled on, automatically adjusts the DENSITY SCALE TOP and DENSITY SCALE BOT settings of the density display based on the amplitude of the signal. DENSITY SCALE TOP Sets the percentage of signal time for the top (red) density scale. DENSITY SCALE BOT Sets the percentage of signal time for the bottom (blue) density scale. Any signal that appears at a rate lower than the DENSITY SCALE BOT setting will not appear in the density plot. DENSITY RES Density resolution sets the FFT size of the RTSA capture. Normal resolution sets a 512 point FFT; High resolution sets a 1024 point FFT. Higher resolution gives finer frequency detail to the density display, but increases POI. Lower resolution will result in a lower POI, but gives less frequency detail to the density display. PERSISTENCE STATE Toggles the persistence state between Variable or Infinite. Infinite persistence means the density plot will not fade away after a signal is no longer present. It is useful for seeing very fast and infrequent signals. Variable persistence sets a user defined time for the density colors to fade. Longer persistence values can be used to best illustrate the signals being observed. PERSISTENCE Sets the decay time of the density display. ACQUISITION TIME The acquisition time sets the update interval for each spectrum trace, spectrogram line, and density display. During the acquisition interval, spectral data from multiple FFTs of the input signal are taken and combined. The acquisition time is adjustable to allow resolving multiple, brief signal events in time and to observe longer term behaviors. COLOR SCALE TOP Defines the amplitudes where the top color on the color setup bar are applied. Any measurement above this amplitude will appear black on the spectrogram window (shown only in Spectrogram). COLOR SCALE BOT Defines the amplitudes where the bottom setting colors on the color setup bar are applied. Any measurement below this amplitude will appear black on the spectrogram window (shown only in Spectrogram). REFERENCE HUE Allows you to customize the Spectrogram color range (Color Bar) and Hue values. The color limits and the reference hue are based on a 360-degree color wheel where default 0 is red (255 0 0) (shown only in Spectrogram). PRESET SETUP Presets the color setup settings. |