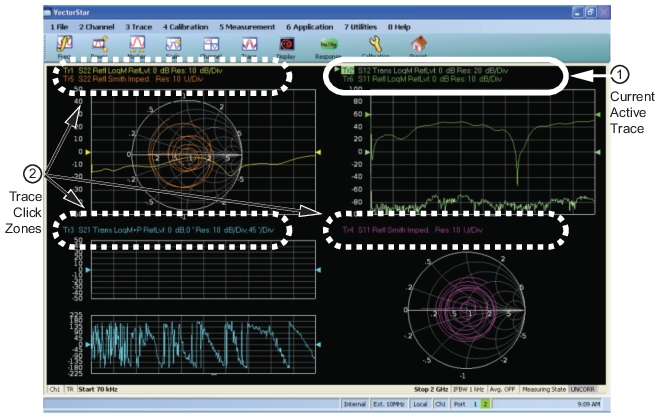
In some sense, the main trace menu is a parallel of the channel menu. Again, the number of traces in the active channel may be specified and one can rotate through the traces using Trace Next and Trace Previous. One can also make a trace active by clicking on its annotation line as suggested by Figure: Trace Activate Click Zones. The active trace is denoted by an inverse color field around the trace number (Tr2 in Figure: Trace Activate Click Zones).
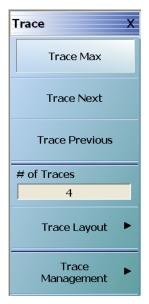
As with channels, the Max function causes the trace (in this case) to occupy the full graph region of the channel. Also as with the Chan. Max, this button is a toggle. Double-clicking on the graph area of the active trace will have the same function as clicking on the Trace Max button. The main Trace menu showing these functions is shown in Figure: TRACE Menu.
The area around the annotation line where one can make a trace active with a direct click is shown below. A double click near the active trace graph area maximizes that trace. Trace 2 (upper right) is currently active in this setup, as evidenced by the inverse video trace number.
Trace Activate Click Zones
1. Current active trace (at top).
2. Trace activate click zones (at left and bottom right).
Trace Menu, Format, and Layout
TRACE Menu
TRACE menu with four traces selected
As with the channel system, there is also a layout submenu for traces (see Figure: TRACE FORMAT Menu for this long menu). Here, however, one may have any number of traces on any graph configuration and the number of traces will not be coerced based on the layout choice. If the number of traces exceeds the number of graph areas selected in the layout, the traces will be overlaid in a sequential fashion that will minimize the number of overlays. As with channels, only certain numbers of graph areas (in the case of traces) are allowed that are semi-symmetric (1, 2, 3, 4, 6, 8, 9, 10, 12, 16) but, unlike channels, blank areas in the graph area grid are allowed if the trace count is less than the graph count.
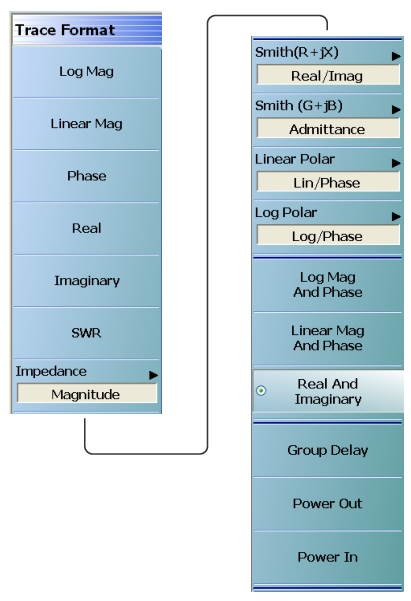
TRACE FORMAT Menu
The actual TRACE FORMAT menu is continuous, with a right-side scroll bar.
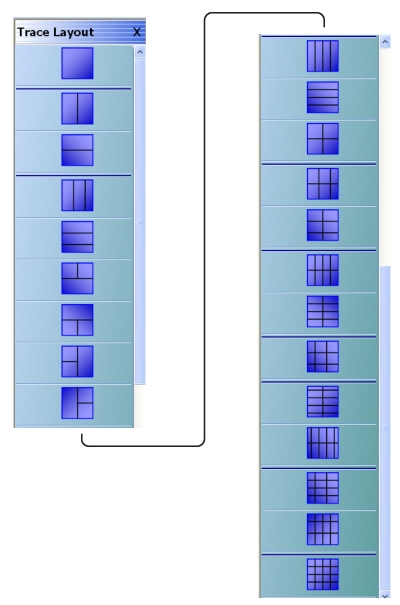
TRACE LAYOUT Menu
The actual TRACE LAYOUT menu is continuous, with a right-side scroll bar.
For example, if five traces are selected but the trace layout is chosen to be three graph areas (vertically oriented), then the traces will be assigned as follows:
• Top graph area: traces 1 and 4
• Middle graph area: traces 2 and 5
• Bottom graph area: trace 3
Of course, a 16-way overlay can be arranged by activating 16 traces but selecting the single graph area (top of the trace layout menu).
Once the number and layout of traces have been defined, usually each trace must be individually configured. In this sense, trace configuration generally applies to post-processing tasks, such as graph manipulation, and some analysis tasks, such as time domain, that are not directly tied to a sweep configuration.
Per-Trace Variables
Per-trace variables include:
• Trace format (graph type)
• Trace memory and math functions (to include inter-trace math which is sort of a hybrid but is defined on a per-trace basis)
• Scale (although autoscale can also be per-channel or per-system)
• Trace impedance (which is different from reference impedance set during a calibration)
• Domain (time domain and frequency w/ time gate)
• Smoothing
• Conversions
• Limit lines
• Markers (although markers can be optionally coupled between traces within a channel)
• Response (S-parameter, un-ratioed parameter, ext. analog in)
Complex Trace Setup Example
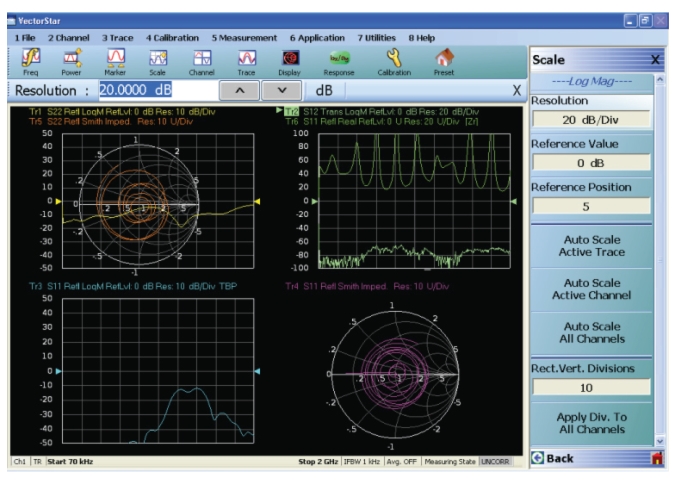
A fairly complex trace setup example is shown in Figure: Multi-Trace Display with right-side SCALE menu below. This example covers multiple graph types and scaling options as well as different transformations applied to the data in certain traces. Here Trace 3 is in time domain, while the others are frequency domain. Most of the traces represent S-parameters, but Trace 6 is in an impedance conversion mode (reflection impedance, covered in another section of this measurement guide). The symbols in the annotation line provide information about these trace definitions. Some of the abbreviations that may appear in brackets in the annotation line are shown in Table: Trace Labels and Annotations below. Details on these functions can be found in other sections of this measurement guide and the VectorStar Operations Manual.
Trace Labels and Annotations
Abbreviation
Definition
FGT
Frequency domain with time gating
TLP
Time domain low pass
TBP
Time domain bandpass
D&M
Data and memory
D/M
Data memory math
D+M
D-M
D*M
M
Memory
Tr1/Tr2
Inter-trace math (other trace numbers and other operators possible)