A number of comments were made in the previous section about the receiver requirements in terms of gain, filtering, linearity and other behaviors. Since these are custom components selected for many measurements, it is important to present a way of assessing a given measurement problem and how to assemble the user provided portions of the composite receiver system.
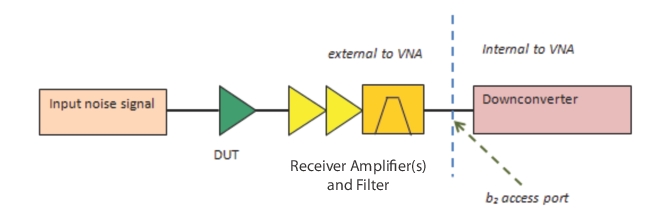
By slightly modifying the diagram in Figure: Noise Figure Measurement Basic Setup Diagram, one can see the delineation of system and user components in Figure: Modified Block Diagram for Locations. The downconverter is accessed through a port associated with the b2 loop (this avoids the loss associated with the coupler on Port 2 and helps improve uncertainties). The port itself can be used if the DUT + external gain is high enough (usually over 60 dB).
The receiver amplifiers are used to reduce the effective receiver noise figure which can dramatically improve uncertainties as will be shown in a later section. The required gain is somewhat dependent on the DUT but 40 dB of gain is a reasonable starting point. Multiple physical amplifiers can be used. The noise figure itself is generally not as critical but less than 5 dB or so is generally desirable. The lower the DUT noise figure, the more important the receiver amplifier noise figure becomes. This will become clearer in the uncertainties section.
Modified Block Diagram for Locations
A modified block diagram is shown here to illustrate locations better.
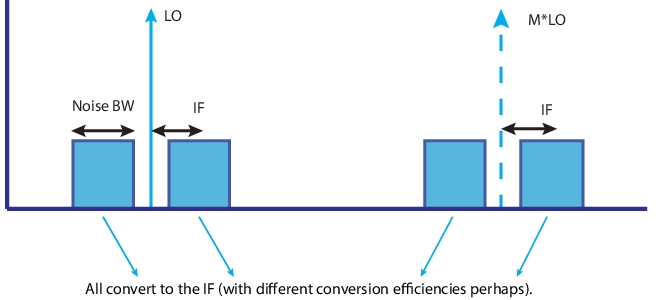
A filter is shown above in Figure: Noise Figure Measurement Basic Setup Diagram and Figure: Modified Block Diagram for Locations and this is for several reasons. As mentioned earlier, if the gain blocks are very broadband, some filtering can help prevent inadvertent receiver compression. Perhaps more importantly, the filter helps prevent image responses of the receiver from complicating the noise figure measurement. To understand this, recall that any downconverter has responses for at least some harmonics of the LO (commonly 3rd, 5th, 7th… for balanced mixers and all harmonics for some structures). Thus noise energy at an IF offset from these LO harmonics will also convert to the system IF and be included in the noise power computation. This effect becomes more pronounced when the desired product is already a harmonic of the basic LO and subharmonic components (which may have more favorable conversion efficiencies) can play a role. The general concept is illustrated below in Figure: Spectral Diagram for Harmonic Conversion in the Downconverter.
Spectral Diagram for Harmonic Conversion in the Downconverter
A spectral diagram is shown here is illustrate how harmonic conversion in the downconverter can add noise sidebands to the result that may be unintentional. Filtering as part of the receiver chain can reduce this issue.
By having a filter in the receiver chain to isolate the LO harmonic of interest, the other multiples can be effectively removed. As an example, suppose measurements are being run over 5 to 10 GHz which happens to be the fundamental LO component. By having a low pass filter in the chain with a corner of about 10 GHz, higher order terms can be removed.
Depending on the roll-off rate of the filter, it may be necessary to split that octave into two bands (e.g., 5 to 8 GHz and 8 to 10 GHz). This decision would be based on the DUT bandwidth as well as the filter behavior: if the DUT is already rolling off at 10 GHz, then a fairly weak stop band filter would be ok but if the DUT gain is fairly flat to much higher frequencies, then a very sharp stop band filter is suggested or the band should be split as mentioned.
For higher frequency measurements, it is useful to recognize that the fundamental LO range is still 5-10 GHz with the normal harmonics being used of 1, 2, 4, and 8 (adding 9 and 11 for ME7838A/AX operation to 110 GHz). The filtering should be designed to remove the other harmonic responses. Recall that the MS464xB has a system breakpoint at 2.5 GHz (lower frequency loops are on the rear panel, higher frequency loops are on the front panel) but this is a natural filtering breakpoint as well. When operating at frequencies lower than a few hundred MHz, additional filtering may be desired (if the DUT has substantial gain to much higher frequencies) to remove effects of the 3rd harmonic and 5th harmonic responses of the low band converter.
From Figure: Spectral Diagram for Harmonic Conversion in the Downconverter, one may question the two noise sidebands centered around the LO signal. Since the VNA input is not preselected, noise energy at an IF offset either above or below the LO will be included. The basic IF frequency is 12.35 MHz so the measurement will effectively be an average over approximately a 25 MHz region. Additional filtering can be employed in narrowband applications where this bandwidth is an issue.