This section describes point-in-pulse measurement examples in more detail and provides guidance on how to select parameters of importance. Point-in-pulse measurements are often used when some portion of the pulse is not of interest and only the averaged result over a specified measurement window is of concern.
Pulsing is often done for thermal reasons or when some measure of basic RF performance in some non-dynamic portion of the pulse is the main measurement requirement, or for both of these reasons. Typically, this measurement is done over swept power or frequency.
Multiple point-in-pulse measurements may be run on different VNA channels where the frequency (or power) sweep parameters and pulse parameters are the same, but the point in the pulse where data is taken is different. In this way, information regarding the sweep parameter and the intra-pulse behavior can be acquired nearly simultaneously.
A pair of power sweeps (perhaps set up in two VNA channels) where the effect of pulse width will be examined provides our example. This example neglects transient effects near the beginning and end of the pulse, but will reveal whether there are any effects related to an increase in pulse width (and, in this case, duty cycle).
In this example, only RF is being pulsed, and the PRI is 0.1 ms. Pulse widths of 20 μs and 80 μs are used, and the point-in-pulse measurement is set to roughly the middle of each pulse with a width of 10 μs. The amount of time between initiation of the stimulus pulse and the measurement is different in the two cases, so the effect may be a convolution of actual measurement time and the duty cycle presented to the DUT. In this simple example, only one pulse generator is used. A delay relative to T0 is used for clarity.
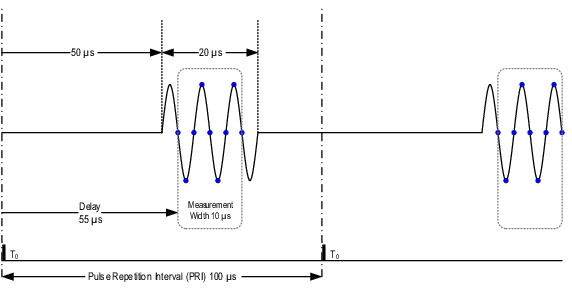
Sweep 1:
Details of Sweep 1 Timing Relationships in the Point-in-pulse Setup Example
• PRI: 100 μs
• Pulse generator 4: delay 50 μs, width 20 μs
• Point-in-pulse position: 55 μs
• Point-in-pulse measurement width: 10 μs
• Power sweep: –10 to 10 dBm, 41 points, frequency CW 18 GHz
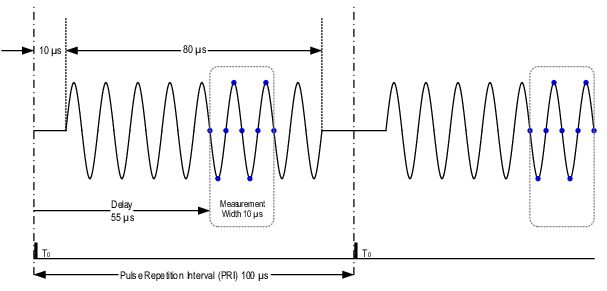
Sweep 2:
Details of Sweep 2 Timing Relationships in the Point-in-pulse Setup Example
• PRI: 100 μs
• Pulse generator 4: delay 10 μs, width 80 μs
• Point-in-pulse position: 55 μs
• Point-in-pulse measurement width: 10 μs
• Power sweep: –10 to 10 dBm, 41 points, frequency CW 18 GHz
If a noise floor signature is observed in the measurement, it is a possible indication that the pulse generator feeding the pulse modulator test set was not inverted.
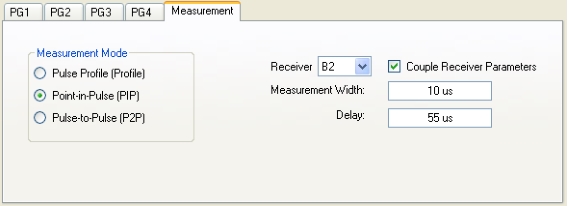
The receiver channels remained coupled in this example, although only b2 is being used for these measurements.
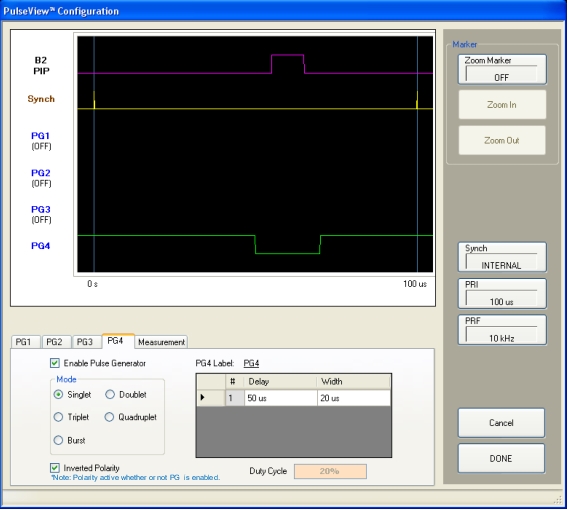
Sweep 1 Settings in Pulse Configuration Dialog Box
Note
The following receiver notations used in text and in the instrument user interface have identical meanings: A1 = a1, B1 = b1, A2 = a2, B2 = b2.
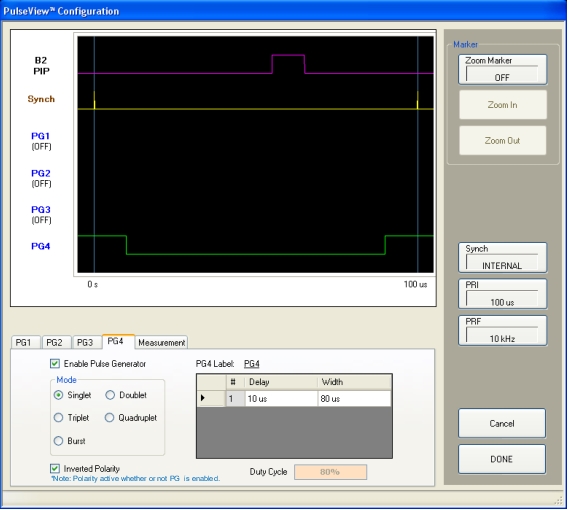
Sweep 2 Settings in the Pulse Configuration Dialog Box
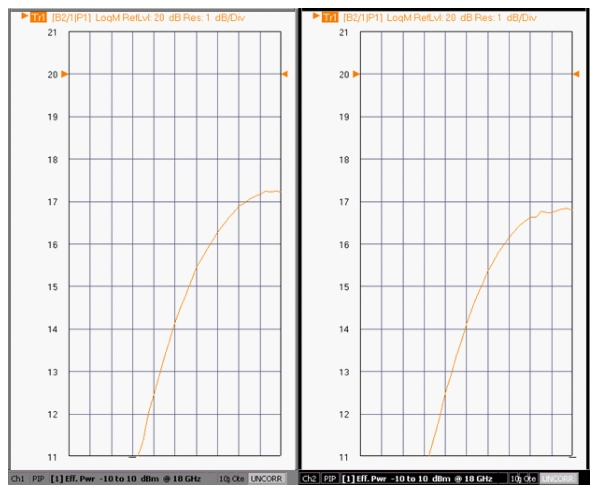
There is a noticeable decrease in saturated power from this device as the duty cycle increases and the measurement pulse is repositioned (relative to the leading edge of the stimulus), as might be expected if there were significant thermal effects present. A receiver calibration was used for this measurement.
Example Results of Two Point-in-pulse Measurements