Uncertainties in pulse measurements are not often covered in great detail. In an ideal situation, possible uncertainties would be dominated by basic S-parameter uncertainties controlled by calibration kits and methods, noise floor and trace noise, linearity, repeatability, drift, and similar factors.
While it is not within the scope of this chapter to thoroughly analyze all of the pulse distortions possible, the most likely types of uncertainties are outlined below.
Time
When troubleshooting, address this variable first. Does the S-parameter reported at a particular time relative to T0 represent what was intended? This can be an issue due to latency in the pulse modulators, external bias systems, the DUT itself, and the VNA. A broad profiling measurement is sometimes a way of assessing the net latency and ensuring that a given time point is indeed the one of interest.
Shaping
Stimulus shape can affect the DUT output. This shaping may arise from the behavior of the RF modulators used or the behavior of any bias system pulsing that is employed. The former can normally be calibrated out, while the latter is an intrinsic part of the measurement.
Calibration
The calibration process itself may introduce some oddities as discussed earlier, particularly when stimulus RF modulation is in play. If the edges of the pulse response are of interest, then the calibration may be acting on reduced dynamic range on parts of the pulse edge resulting in elevated net trace noise.
Minimizing Uncertainties
To help reduce uncertainties, increases in averaging or reduction in IFBW in these measurements are advised—along with not trying to measure deep into the noise floor unless necessary. Power level increases can sometime also help if the DUT can support it and one avoids receiver compression.
Nominally, 0.1 dB compression is above +10 dBm at the port and higher, if the step attenuators of Options 61/62 are engaged. If accessing the loop paths to the receivers, compression levels will be lower by the coupling factors of the couplers/bridges. Nominally this value is 13 dB.
Other artifacts can occur with RF stimulus modulation, particularly at low frequencies. These include video energy from the pulse drive itself that can appear on the frequencies of interest.
The Anritsu measurement test employs high pass filters for frequencies greater than 2.5 GHz. If at lower frequencies or using an external RF modulator, one may want to apply a high pass filter to the stimulus.
Other approaches to reduce uncertainties may include pre-filtering the pulse drives to soften the edges somewhat and reduce video harmonic content. As has been discussed earlier, the use of a pulsed reference signal (available in the Anritsu measurement test set for routing to the reference loops on the VNA) can help reduce these video effects somewhat.
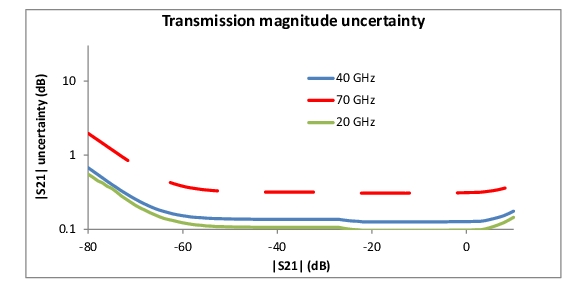
To help illustrate some of the concepts and to provide hints as to how the uncertainties will vary in this vast parameter space, consider two examples. In the first, video effects and transients are neglected. The measurement may be a PIP measurement in which the measurement window is well away from the pulse edges, or it could be the middle of a pulse in a pulse profiling measurement. A plot is shown in Figure: Estimate of Transmission Uncertainty for a Mid-pulse Measurement Under Certain Conditions under the following conditions:
• Pulsed bias only (stimulus modulator loss not included, nominally 5 to 6 dB at 40 GHz for high on/off ratios such as in an Anritsu Pulse Modulator Test Set; double that value if also using the receiver-side RF modulator)
• 1 kHz net IF bandwidth
• Sweep-by-sweep averaging of 5 sweeps
• VectorStar VNA default source power
As with all digitizing measurements, this result is independent of duty cycle, unlike with the single spectral line methods.
Estimate of Transmission Uncertainty for a Mid-pulse Measurement Under Certain Conditions
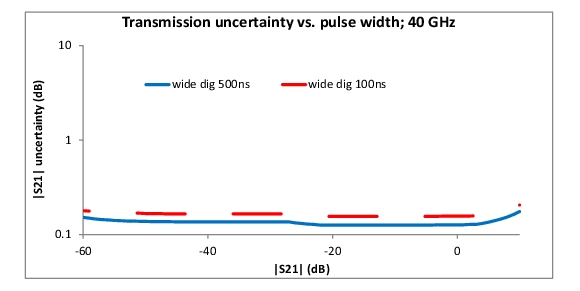
In the second example, consider a specific overshoot measurement, where the pulse had about a 20 % overshoot of width ~20 ns. Since the transient behavior is critical here, the pulse width relative to the IF bandwidth of the system comes into play. Correspondingly, calculations will be performed for a couple of pulse widths. The narrower pulse has a wider spread of energy, so the hardware filter edges distort the content more than for a wider pulse. The PRI was kept relatively low in this case, making the individual spectral line behavior less important. The effective IFBW was again low and the power setup from the previous example applies here. One can see the pulse width effect in Figure: Example Uncertainty Computation, but it should be emphasized that the values are specific to the particular pulse waveform under study. The central point is that all of the measurement parameters can play a significant role in pulse measurement uncertainty.
Example Uncertainty Computation
An example uncertainty computation for the value of pulse overshoot as a function of DUT transmission and pulse width.