 |
|
Icon | Description |
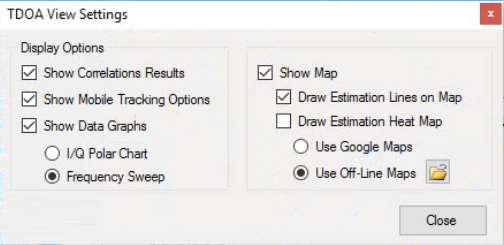
Show Correlation Results Click the Show Correlations Results check box to show the Correlation Results window, or click to hide the Correlation Results window. | |
Show Mobile Tracking Options Click the Mobile Tracking Options check box or click to hide the Mobile Tracker window. | |
Show Data Graphs Click the Show Data Graphs check box to show the TDOA and IQ window, or click to hide the TDOA and IQ window. • I/Q Polar Chart: Click to toggle display view to an IQ Polar Chart. • Frequency Sweep: Click to toggle display view to a Frequency Sweep Chart. | |
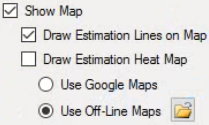 | Show map Click the Show Map check box to display the map window or click to hide the map window. Draw Estimation Lines on Map Click to show correlation estimation lines as shown in Figure: TDOA Map Measurement Display. Draw Estimation Heat Map Click to show correlation estimation results as a heat map. • Use Google Maps: Click to use a live connection to Google Maps at Maps.Google.com • Use Off-Line Maps: Click to use off-line maps. |