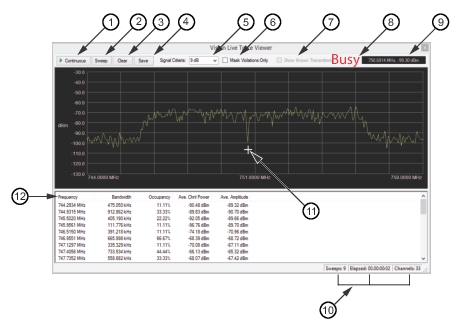
Live Data Stream provides a user interface screen to view a live stream of trace data. The live trace parameters are displayed also.
Live Trace Viewer
1. Continuous
2. Sweep
3. Clear
4. Save
5. Signal Criteria
6. Mask Violations Only
7. Show Known Transmitters
8. Busy Indicator
9. Mouse Marker Readout Field
10. Metrics Log (Sweeps, Elapsed, Channels)
11. Mouse Marker
12. Traces Parameters Field
Continuous
Click to continually collect trace data. Click again will stop trace data collection.
Sweep
Click to generate and capture a single sweep.
Clear
Click to clear all results.
Save
Click to save the resulting sweep data in either HTML or Tab delimited format.
Signal Criteria
Click to set the criteria for determining peak thresholds in the trace data.
Mask Violations Only
Click to check the box to include only the traces that violate a mask in the results table.
Show Known Transmitters
Click the box to display the known transmitters within the bandwidth of the displayed trace. This box will remain grayed until known transmitter files have been loaded. A user created list of known transmitters is required to be loaded first before they will be available to display. This is achieved from within the Trace Monitor trace display window via the Transmitter Menu Button menu. For more information on loading a known transmitter file, SeeLoading the Known Transmitter (.lst) File.
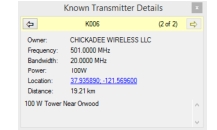
Once the user created list of known transmitters has been loaded and then selected, any known transmitters will appear as white vertical lines above the trace. Selecting one of these lines will display a dialog box with the transmitter details. See Figure: Known Transmitter Details.
Known Transmitter Details
Busy Indicator
BUSY indicator is displayed when the current probe is in use from another user or Vision Acquire.
Mouse Marker Readout Field
The signal’s frequency and amplitude correlating to the mouse location on the display.
Metrics Log
When either in continuous sweep or paused, selecting the Clear button will reset the Sweeps and Channel count to zero. The elapsed time metric however does not reset. Instead, when sweeping is paused, then resumed, the elapsed time resets to zero. Neither the sweep count nor the channel count resets in this case.
• Sweeps: Records the number of sweeps per session.
• Elapsed Time: Records the elapsed time from start until paused or stopped.
• Channels: The number of channels that are being swept.
Mouse Marker
The location of mouse pointer.
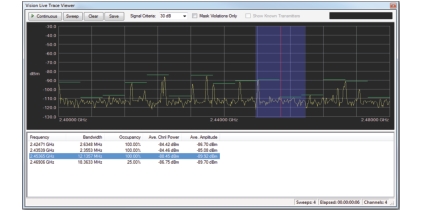
Trace Parameters Field
The Trace Parameter Field displays each trace frequency.
• Frequency
• Bandwidth
• Occupancy
• Ave. Chnl Power (Average Channel Power)
• Ave. Amplitude (Average Amplitude)
To view a frequency and its associated bandwidth on the sweep spectrum, click Continuous a second time to pause the sweep. Click a readout in the Trace Parameters Field to view the marker frequency and bandwidth on the user interface screen. See Figure: View Selected Sweep.