 |
|
Icon | Description |
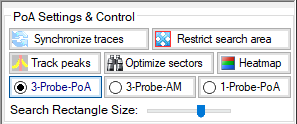
 | Synchronize Traces in Time Toggles time synchronization between the three monitors used in the location algorithm. Each trace graph has a horizontal scroll bar that allows the user to scroll through the trace history and look for a particular trace that exhibits the interference most strongly. |
Restrict Search Area Toggle Clipping mode: Only looks for sources in the overlap region of sectors. | |
Peak Tracking Tracks signal peaks. | |
Optimize Sectors Find Sectors with maximum Power at Source Frequency. Click to locate base station(s) that transmit the most power at the source frequency. | |
Show Heat Map Isolates the interferer signal by displaying a heat sense map over the suspected region. | |
3-Probes-PoA Triangulate the interferer position when the signal of interest can be seen on three near-by monitors. This is normal mode. | |
3 Probes-AM Triangulate the interferer position in AM-mode when the signal of interest can be seen on three near-by monitors. | |
 | 1-Probes-PoA View signals at a single monitor, from the Probe pull-down list above the top trace display. 1 Probe detection is only useful if the interferer can be seen in the sweep data on two more channels on the same monitor. Save PoA mode to 1-probe (Angle of Arrival). |
Search Rectangle Size Use the scroll bar to set the line lengths on the map. |