This section assumes that an IQ data file has already been imported from an Anritsu receiver or instrument. For instructions on creating and importing an IQ Data File from the receiver or instrument to the MX280005A Vector Signal Analysis software application, find your product on the Anritsu product page: https://www.anritsu.com/en-US/
Procedure
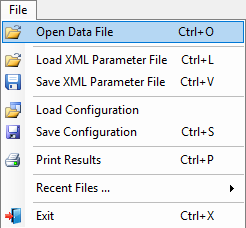
A data file location is created when the MX285000A Vector Analysis Software has been loaded. The default location is created in the Documents folder. The path is: Documents | Anritsu | IQ Files. From the MX285000A menu bar, click File and select Open Data File as shown in Figure: Open Data File.
Open Data File
Open the .dgzm File
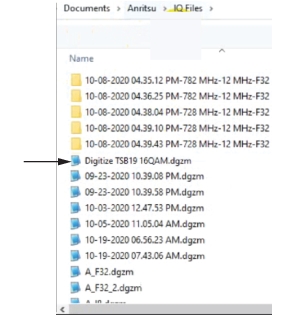
1. Go to the IQ Files folder. Unless renamed by a user, all the .dgzm files are saved with a time stamp. Here we select the user renamed file as indicated in Figure: .dgzm File Time Stamp.
.dgzm File Time Stamp
2. Open the .dgzm file.
3. View the displayed MX280005A UI.
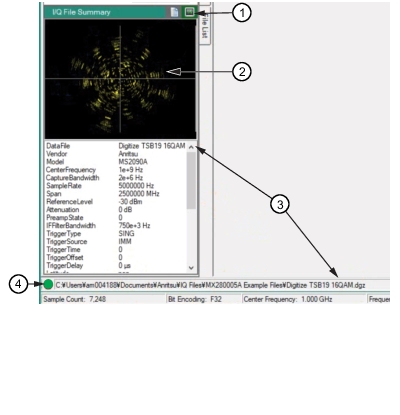
4. Click the IQ Summary Icon to show the IQ Summary window as shown in Figure: View IQ Summary.
View IQ Summary
1. IQ Summary Icon
2. IQ Summary Quick View
3. Selected Data File
4. Signed/Unsigned Indicator
5. Verify the data pattern displayed in the quick view window a composed view and not random data.
6. View the Selected Data File to confirm this is the file that will be analyzed.
If a data file had been preselected from the Standard Predefined Templates, the Modulation, Filter, Data, and Detail Settings dialogs would be preset. For this example, data for these dialogs is entered as follows:
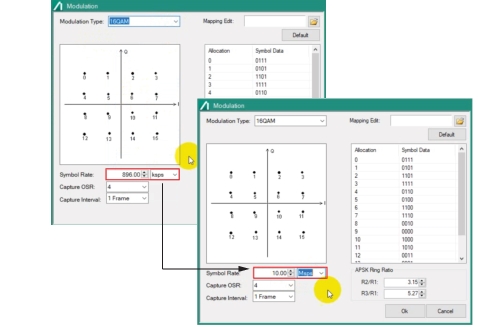
1. Click the Modulation button.
2. Click the Modulation button to open the Modulation dialog.
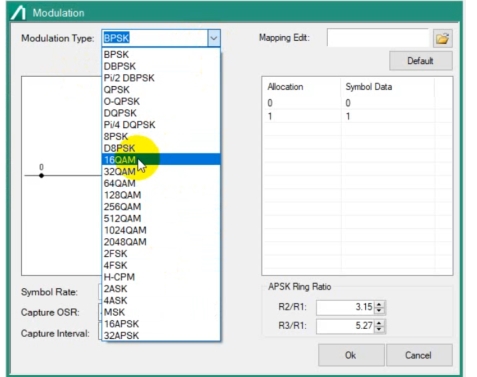
3. Click the Modulation Type arrow.
4. Click the modulation type list. For this example, 16QAM is selected.
Modulation Type List
5. Type Corresponding Capture Parameters. For this example, the only change from the default settings is Symbol Rate set to 10 Msps.
Type Symbol Rate
After each Parameter Setup is clicked Ok, the corresponding button turns green.
Type Filter Parameters
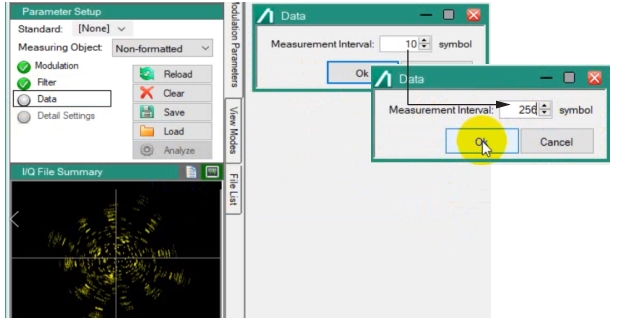
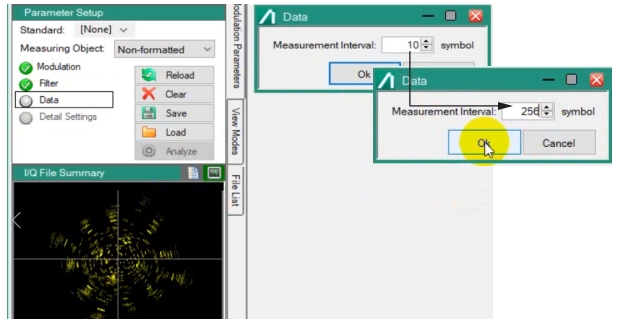
Set Up Data Parameters.
1. Click the Data button.
2. Review and change the Measurement Interval per your data measurement requirement. In this example, the amount of symbols that defines a frame is 256.
Type Data Parameter
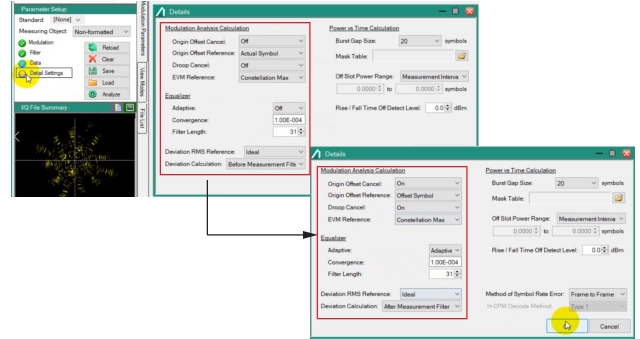
Set Up Details Settings Parameters
The Detail Settings sets up the measurement display.
1. Open the Detail Settings dialog.
2. Set the parameters to create the type of modulation analysis desired. Refer to Figure: Set Up Details Settings. In this example, the detail settings have been set as follows:
3. Set Origin Offset Cancel to On.
4. Set Origin Offset Reference to Offset Symbol.
5. Set Droop Cancel to On.
6. Set Adaptive to Adaptive.
7. Set Deviation Calculation to Before Measurement Filter. All other default settings are set.
8. Click Ok,
Set Up Details Settings
Initiate IQ Data Demodulation
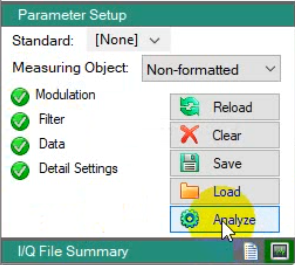
To initiate the IQ data demodulation analysis, click Analyze as shown in Figure: Set Up Details Settings. Note all of the Parameter Setup buttons should be green.
Analyze IQ Data
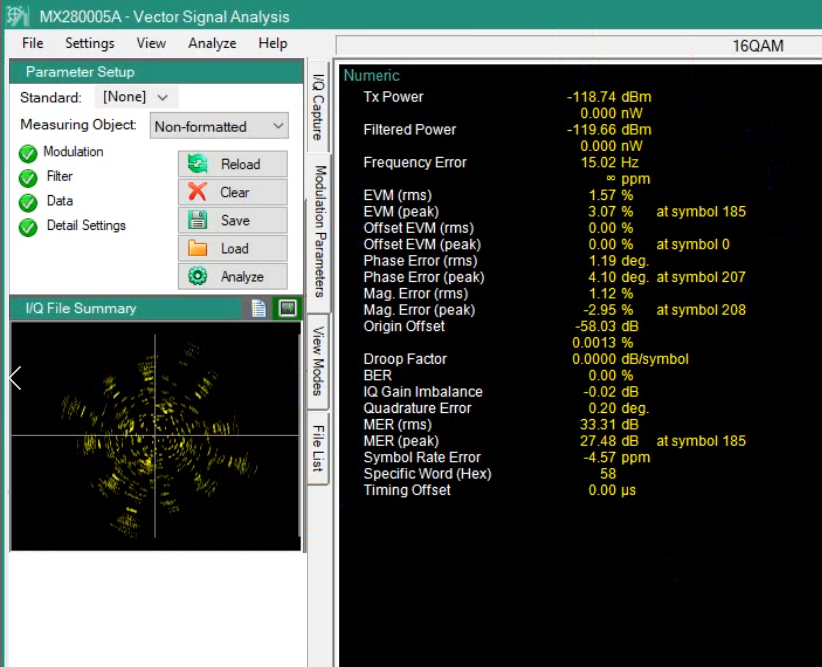
The data processing will take a few seconds to complete, In this example, no prior View Modes Tab had been selected so the default view mode in Numeric as shown in Figure: Results in Numeric View.
Results in Numeric View
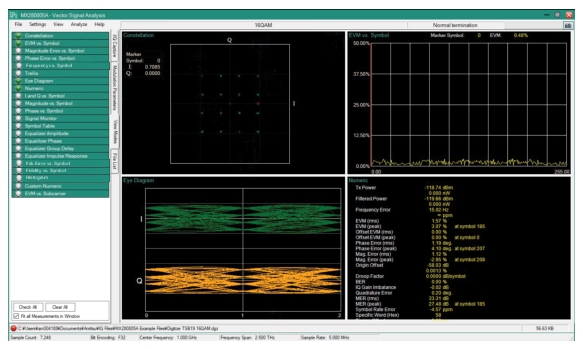
If other View Modes are already selected, those view modes will also be populated with the new results. As the modulation data is analyzed, different view modes can then be selected as well. In this example, Constellation, EVM vs. Symbol, and Eye Diagram have been selected along with the default Numeric view as shown in Figure: Four View Modes. Additional modulation analysis views can be selected and added to the views. Click Check All at the bottom-left section of the display screen to select and display all of the modulation analysis views.