 |
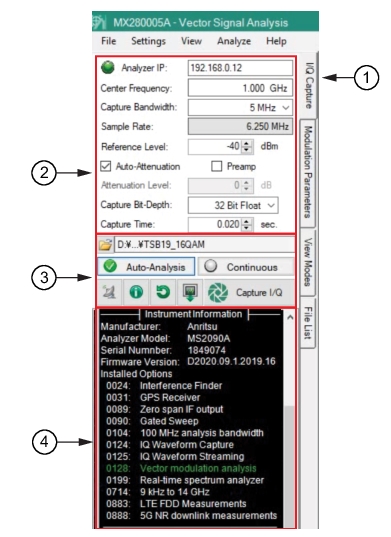
1. IQ Capture Tab 2. Spectrum Analyzer Parameter Settings 3. Capture/Analysis Buttons 4. Status Window |
|
1. IQ Capture Tab 2. Spectrum Analyzer Parameter Settings 3. Capture/Analysis Buttons 4. Status Window |
- | Analyzer IP An IP address entry turns the status green when the connection is successful and option 0128 is installed on the connected spectrum analyzer. |
Center Frequency Button Displays the Spectrum Analyzer Center Frequency. Pointing the mouse over the button enables a gray background indicating that the user can type to edit the center frequency. Press the button sends the center frequency to the SPA. | |
Capture Bandwidth Displays the Capture Bandwidth frequency bandwidths list. Point the mouse over the button enables a gray background indicating that the user can type to edit the center bandwidth. Press the button sends the capture bandwidth to the SPA. Range: 36 kHz, 280 kHz, 1.25 MHz, 1.5 MHz, 2.5 MHz, 3 MHz, 5 MHz, 6 MHz, 10 MHz, 12 MHz, 18 MHz, 20 MHz, 25 MHz, 36 MHz, 40 MHz, 50 MHz, 74 MHz, 80 MHz, 100 MHz, 110 MHz. | |
Sample Rate Displays the sample rate per the Center Frequency and Center Bandwidth entered. | |
Reference Level Set instrument reference level. Press the button sends the reference level to the SPA. Range: 20 to -100 dBm | |
Auto-Attenuation Check to apply Auto-Attenuation. When unchecked, the Attenuation-Level selection becomes unavailable. | |
Preamp state Check to select the preamp state ON. Uncheck selects the preamp state OFF. | |
Attenuation Level Type or enter an attenuation level. Press this button sends the attenuation level to the SPA. | |
Capture Bit Depth Set IQ capture bit-depth. | |
Capture Time Set IQ capture time. See Maximum Capture Time. Range: 0.010 to 0.500 seconds. | |
 S S | File Location Set active data file path. |
Auto-Analysis Automatically performs an analysis of the signal that is being captured by the spectrum analyzer. This button is active for analysis only when the Analyzer IP button from the IQ Capture tab is active (green) and the Analyze Analyze button from the Modulation Parameters tab is enabled (green). See Auto-Analysis. | |
Continuous Pings the Spectrum Analyzer to continually capture data, perform an analysis, and update graphs. The ping and capture time to perform each analysis could take a few seconds depending on the complexity of the analysis. See Continuous. | |
 | Ping Confirms and displays the communication connection response time in the instrument information window. See Status Window below. |
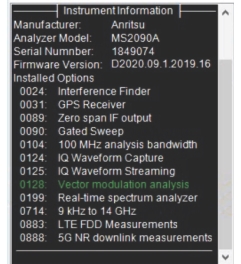
 | Information Button Displays the spectrum analyzer identification details in the window. The details include: • Analyzer Model (Green entry indicates option connection successful) • Analyzer Installed Options • Analyzer Firmware Version Analyzer Serial Number Installed |
 | Preset Spectrum Analyzer Performs a preset on the Spectrum Analyzer. |
 | Retrieve Spectrum Analyzer Settings The MX280005A retrieves to match the Spectrum Analyzer settings before capturing. |
 | Capture IQ Data Performs IQ Capture. When capturing, IQ data is saved as a file on the Spectrum Analyzer. After capture, .dgz and .dgzm files are copied to the PC and deleted from the Spectrum Analyzer. This allows the analyzer to sign the .dgzm file. A new file is automatically selected for processing and demodulation parameters must be set. Because .dgz files must be signed, and becomes invalid if a file is converted, there are no conversion or alternate file format options. |
 |
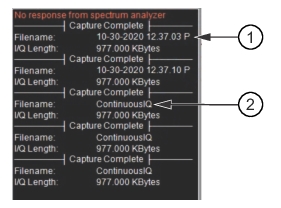 |
1. Press Capture I/Q Button Results 2. Press Continuous Results |
 |
 |