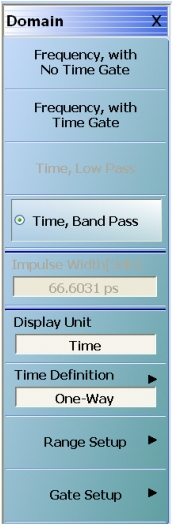
The Bandpass Time Domain mode is similar to low pass, but a few menu items change. Any graph type can be used with bandpass mode, but log magnitude and linear magnitude are the most common. The top level of the time domain menu is repeated in Figure: Top Level DOMAIN Menu—Time, Band Pass Selected for convenience. This menu level does not change between the time domain modes. An example measurement (of a short on a transmission line like in Figure: TIME DEFINITION Menu) is shown in Figure: GATE SETUP Menu. Here, a real and imaginary plot is shown to illustrate the difference from the pure real low pass time domain result, but this graph type is not commonly used in practice.
Top Level DOMAIN Menu—Time, Band Pass Selected
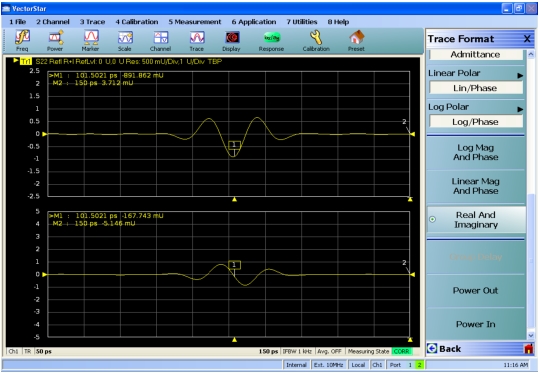
An example bandpass time domain plot is show below for a short at the end of a transmission line. In a log magnitude display, there is a single impulse of approximately unity amplitude near the 100 ps mark.
Example Bandpass Time Domain Plot
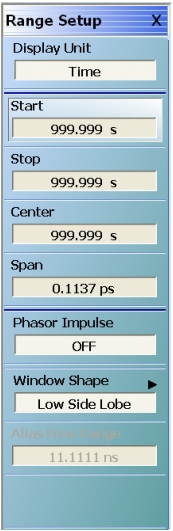
The range menu for bandpass mode is shown in Figure: RANGE SETUP Menu for Bandpass Time Domain. The differences here are that the response choice and DC terms are gone since they do not apply to this mode, and a new item appears: Phasor Impulse.
RANGE SETUP Menu for Bandpass Time Domain
In low pass mode, the sign of the data can be used to provide some hints as to the nature of the defect (inductive or capacitive). It is less obvious in bandpass mode since the time domain data is complex. A function termed Phasor Impulse Mode is an attempt to simulate the data reduction of low pass mode when operating in bandpass mode. It is only correct if the defect can be described by a single defect (a single complex exponential in the frequency domain). The range should be adjusted to have one peak on screen occupying a reasonable fraction of the span. The Phasor Impulse function processes this single peak to produce a pure real transform carrying sign information much like lowpass mode (positive for inductive, negative for capacitive).
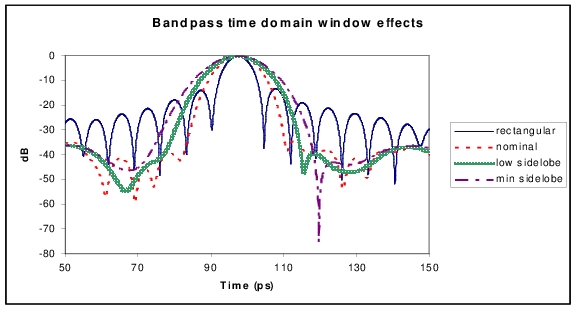
The window shapes have the same effect as in low pass but the starting resolution is only half that of low pass (the window effects are multiplicative). The window effects are illustrated in Figure: Window Effects in Bandpass Time Domain and correspond to the measurement of Figure: Example Bandpass Time Domain Plot, but expressed in log magnitude. Note the trade-off of side lobe height for main lobe width and that the lobe width is twice that for low pass (Figure: Effects of Window Shapes Plot).
Window Effects in Bandpass Time Domain
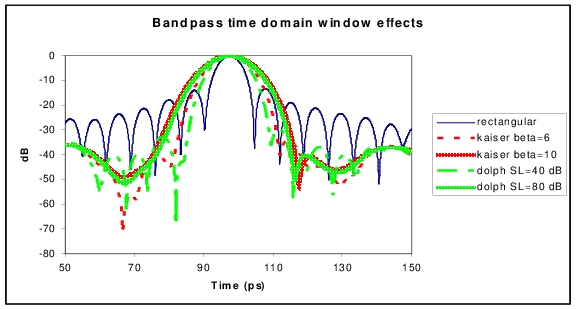
As with lowpass time domain, the Advanced Windows are also available. Some example results are shown below compared to the rectangular window for a few parameter values.
Window Effects in Bandpass Time Domain (advanced window types)