This chapter provides time domain measurement guidelines and procedures. General descriptions, key concepts, and example procedures are presented for time domain measurement modes of low pass, bandpass and gating. This chapter also covers eye diagram calculations (requires Option 47 in addition to Option 2) which present a time domain representation of the result of a digital data stream passing through the DUT being measured.
Introduction
The time domain option offers the ability to transform the native frequency domain data of the MS464xB Series VNA into time domain information for TDR-like displays, distance-to-fault analysis, and general spatial-based circuit and network troubleshooting. Uses for time domain include:
• Identifying the location of significant mismatches/discontinuities in a launch structure in a fixture or PC board
• Finding and quantifying defects in a cable assembly
• Identifying the characteristics of a discontinuity (inductive or capacitive) in a transition within a fixture or on-wafer
• Determining semi-quantitatively the impedance levels in a cascaded series of transmission lines
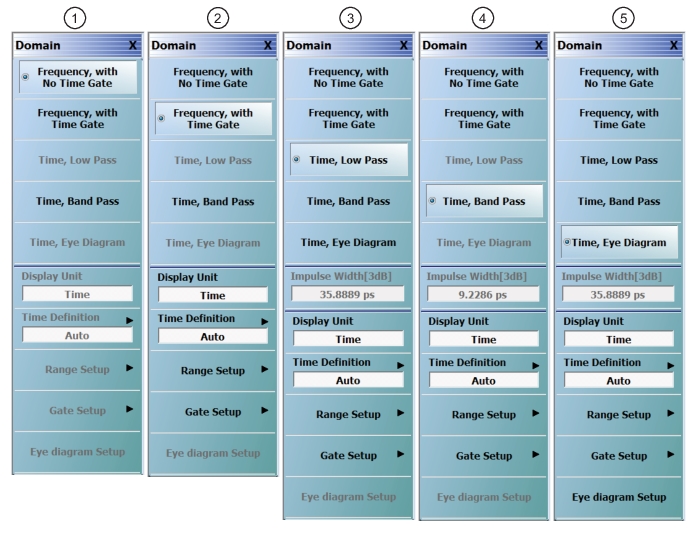
There are a significant number of choices in how to configure the transformations that this section will cover. To begin, time domain is a per-trace invocation so that, within a given channel, frequency domain and time domain traces can be freely mixed on any response parameter. Note that since there is a single x-axis readout per channel, and it will be in the units of the active trace (either frequency or time range, not both at the same time will be displayed). Time domain and the TIME DOMAIN menu is accessed from the DISPLAY menu (and its top level selections are shown in Figure: Domain Menu Variations Based on Time Domain Mode Selection (1 of 2).
Domain Menu Variations Based on Time Domain Mode Selection (1 of 2)
The presence and availability of some DOMAIN menu selections depend on the time domain mode selected on the DOMAIN menu, as well as on the SWEEP TYPES and FREQUENCY menus.
1. Frequency, with No Time Gate selected
2. Frequency, with Time Gate selected (FTG)
3. Time, Low Pass selected
4. Time, Band Pass selected
5. Time, Eye Diagram (TED) selected
Basic Time Domain Modes
The five basic modes of the Time Domain menu are:
• Frequency With No Time Gate
This is the regular frequency sweep mode.
• Frequency With Time Gate
This is frequency domain data that has passed through time domain where a gate is applied to exclude certain data (such as to remove certain defects) before returning to the frequency domain.
• Time, Low Pass
A time domain mode where frequency content fairly close to DC is available (start frequency no more than about 10 step sizes). Step response (like a TDR) processing is available and resolution is better but this mode may not be available for all frequency lists. The selection will be greyed out if incompatible.
• Time, Bandpass
A time domain mode for any frequency list. Only impulse response can be displayed, defect identification tools are more limited, and resolution is a factor of 2 worse than in lowpass (for the same sweep width) but it can be used for any frequency sweep. This is the only choice in band-limited scenarios such as waveguide.
• Time, Eye Diagram
Eye diagram is a slightly different time domain mode in that it is not a strict transform process but presents the calculated output (expressed as an overlaid time waveform) of the DUT being measured when it is stimulated with a user-specified, synthetic digital data stream. This mode may not be available for all frequency lists. The selection will be greyed out if incompatible.