Each model of remote spectrum monitors contains an embedded web server. Using a browser (Google Chrome and Firefox are supported), users can access the graphical user interface (GUI) and send control commands to the remote spectrum monitor. Tabs and Setup Panels can change location in the web browser depending on the size of the browser.
The Graphical User Interface (GUI) measurement display provides manual measurements control and measured trace data. The Graphical User Interface (GUI) is shown below in Figure: Remote Spectrum Monitor GUI Overview.
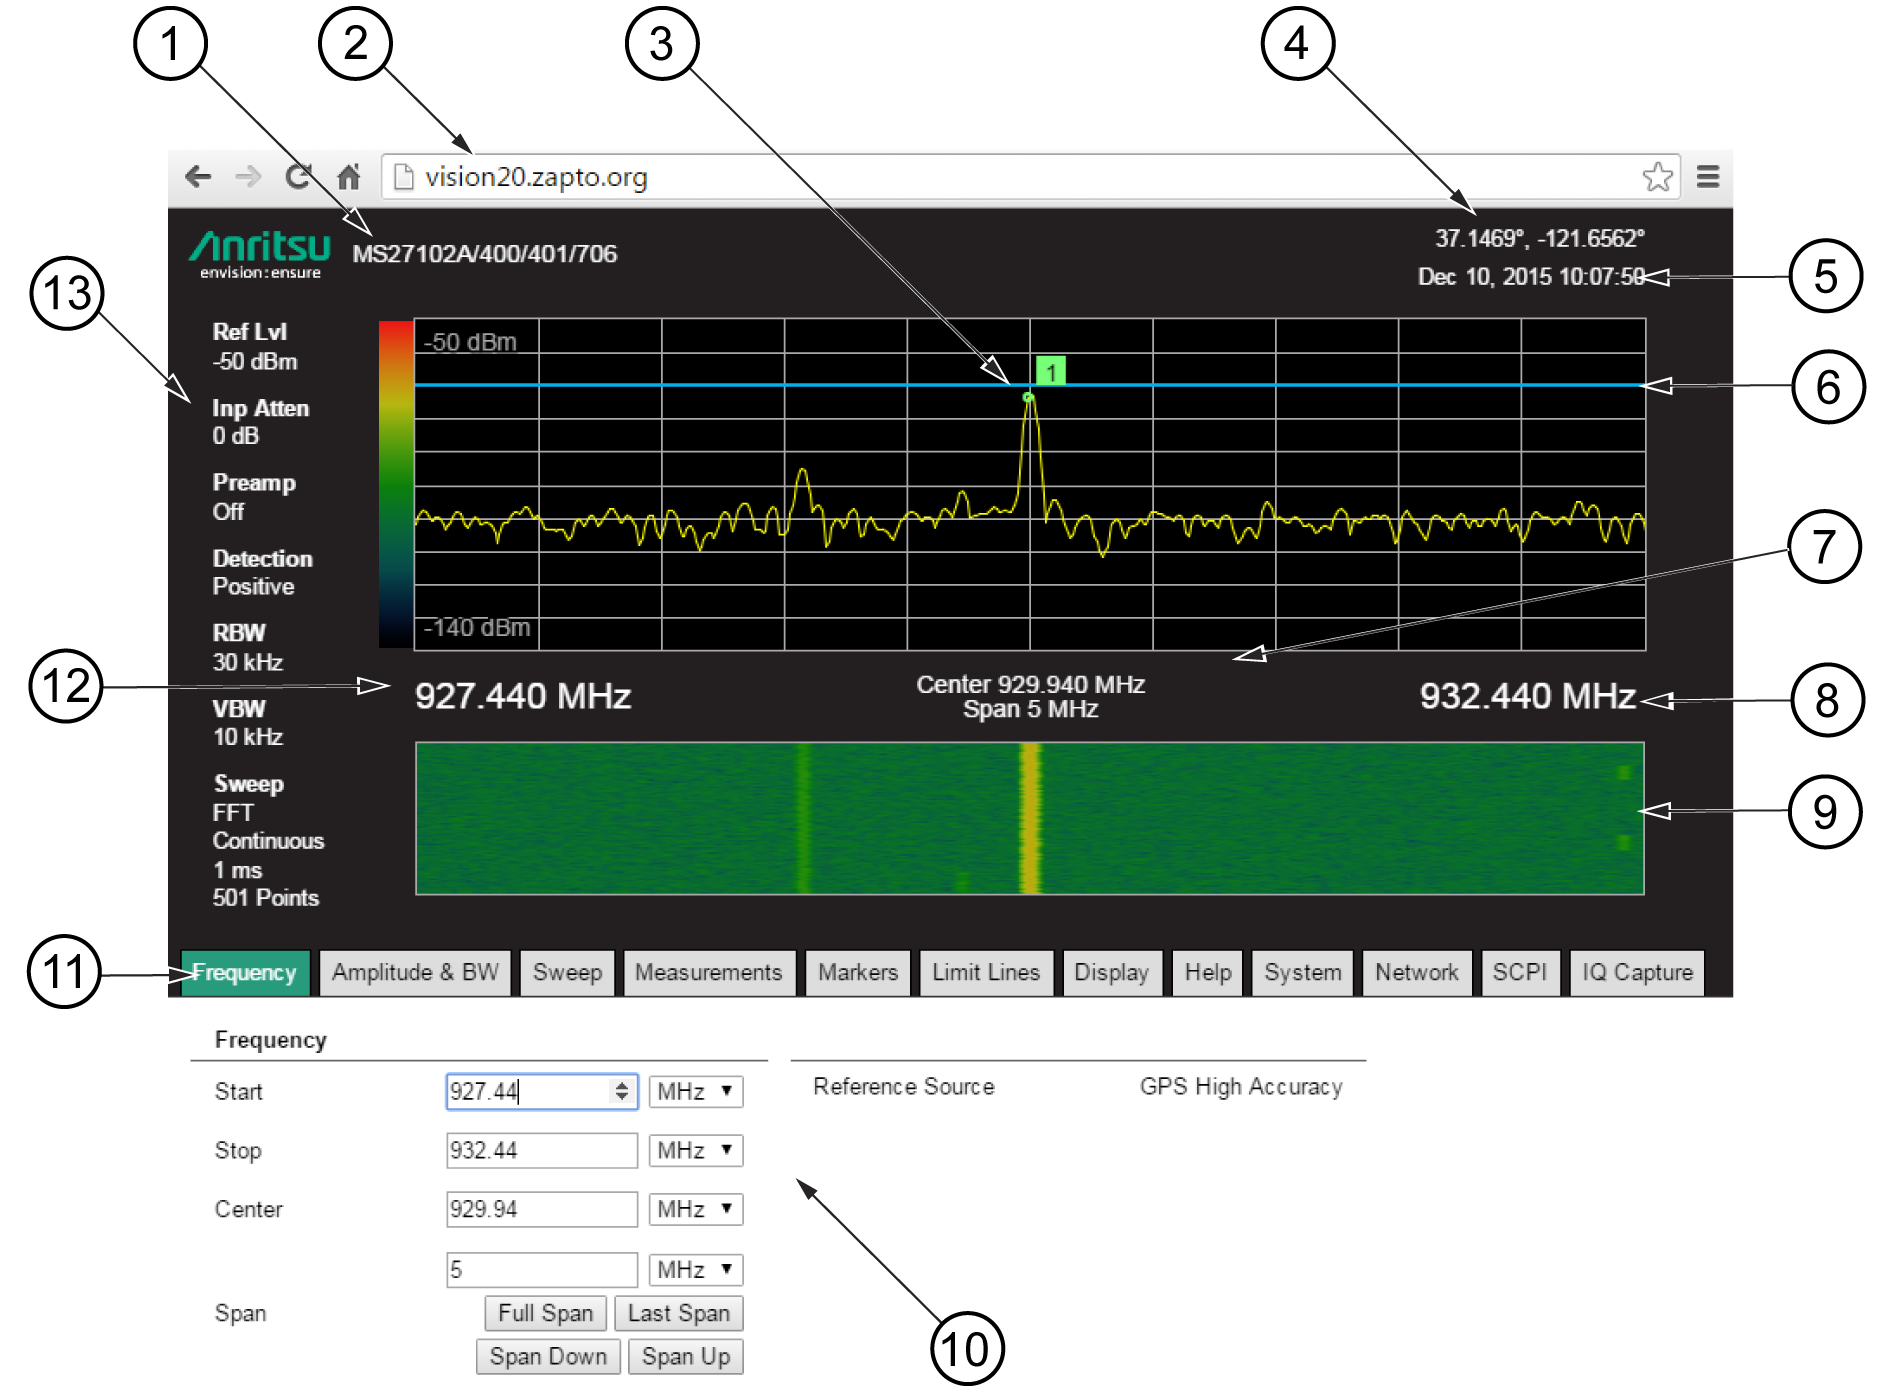
Remote Spectrum Monitor GUI Overview
1. Model and Option Number(s)
2. Web/IP Address
3. Marker
4. GPS Coordinates
5. Date and Time
6. Limit Line
7. Center Frequency and Span
8. Stop Frequency
9. Spectrogram
10. Setup Panel
11. Setup Tabs
12. Start Frequency
13. Instrument Settings Summary
Model and Option Number(s) Web Address
Displays the model of the remote probe and the option(s) installed.
Web Address Model and Option Number(s)
The IP address of the Remote Spectrum Monitor entered into the Web Browser’s address window.
Instrument Settings Summary
The Settings Summary lists the current settings for the reference level, input attenuation, RBW, VBW, sweep mode and type, and display points of the instrument.
Markers
Set up markers on the trace displayed. Eight markers are available for trace analysis.
GPS Coordinates
Displays the GPS coordinates of the measured signal.
Date and Time
Displays the date and time of the real time display.
Limit Line
Displays a limit line from the limit line setup panel.
Center Frequency and Span
Displays the Center Frequency and Span settings.
Stop Frequency
Displays the stop frequency of the displayed sweep.
Spectrogram
Spectrogram is a representation of the frequency spectrum as it varies with time.
Setup Panel
Displays the parameter entry fields of the selected Setup Tabs.